
Understanding Basic Statistics 6th Edition by Charles Henry Brase,Corrinne Pellillo Brase
Edition 6ISBN: 978-1111827021Understanding Basic Statistics 6th Edition by Charles Henry Brase,Corrinne Pellillo Brase
Edition 6ISBN: 978-1111827021 Exercise 26
Draw a scatter diagram for the data.
(b) Find
 , b , and the equations of the least squares line. Plot the line on the scatter diagram of part (a).
(c) Find the sample correlation coefficient r and the coefficient of determination r 2. What percentage of variation is y is explained by the least-squares model
Desert Ecology: Wildlife Bighorn sheep are beautiful wild animals found throughout the western United States. Data for this problem are based on information taken from The Desert Bighorn , edited by Monson and Sumner (University of Arizona Press). Let x be the age of a bighorn sheep (in years), and let y be the mortality rate (percent that die) for this age group. For example, x = 1, y = 14 means that 14% of the bighorn sheep between 1 and 2 years old died. A random sample of Arizona bighorn sheep gave the following information:
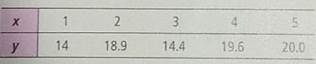
Complete parts (a) through (c), given
x = 15; y = 86.9; x 2 = 55; y 2 = 1544.73; xy = 273.4
(b) Find
, b , and the equations of the least squares line. Plot the line on the scatter diagram of part (a).(c) Find the sample correlation coefficient r and the coefficient of determination r 2. What percentage of variation is y is explained by the least-squares model
Desert Ecology: Wildlife Bighorn sheep are beautiful wild animals found throughout the western United States. Data for this problem are based on information taken from The Desert Bighorn , edited by Monson and Sumner (University of Arizona Press). Let x be the age of a bighorn sheep (in years), and let y be the mortality rate (percent that die) for this age group. For example, x = 1, y = 14 means that 14% of the bighorn sheep between 1 and 2 years old died. A random sample of Arizona bighorn sheep gave the following information:
Complete parts (a) through (c), given
x = 15; y = 86.9; x 2 = 55; y 2 = 1544.73; xy = 273.4
Explanation Verified
(a) Scatter Diagram:
![]() The above scatte...
The above scatte...
Understanding Basic Statistics 6th Edition by Charles Henry Brase,Corrinne Pellillo Brase
Why don’t you like this exercise?
Other Minimum 8 character and maximum 255 character
Character 255


