
Understanding Basic Statistics 6th Edition by Charles Henry Brase,Corrinne Pellillo Brase
Edition 6ISBN: 978-1111827021Understanding Basic Statistics 6th Edition by Charles Henry Brase,Corrinne Pellillo Brase
Edition 6ISBN: 978-1111827021 Exercise 33
Draw a scatter diagram for the data.
(b) Find
 , b , and the equations of the least squares line. Plot the line on the scatter diagram of part (a).
(c) Find the sample correlation coefficient r and the coefficient of determination r 2. What percentage of variation is y is explained by the least-squares model
Sociology: Job Changes A sociologist is interested in the relation between x = number of job changes and y = annual salary (in thousands of dollars) for people living in the Nashville area. A random sample of 10 people employed in Nashville Provided the following information:
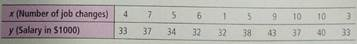
Complete parts (a) through (c), given
x = 60; y = 359; x 2 = 442; y 2 = 13,013; xy = 2231
(d) If someone had x = 2 job changes, what does the least-squares line predict for y , the annual salary
(b) Find
, b , and the equations of the least squares line. Plot the line on the scatter diagram of part (a).(c) Find the sample correlation coefficient r and the coefficient of determination r 2. What percentage of variation is y is explained by the least-squares model
Sociology: Job Changes A sociologist is interested in the relation between x = number of job changes and y = annual salary (in thousands of dollars) for people living in the Nashville area. A random sample of 10 people employed in Nashville Provided the following information:
Complete parts (a) through (c), given
x = 60; y = 359; x 2 = 442; y 2 = 13,013; xy = 2231
(d) If someone had x = 2 job changes, what does the least-squares line predict for y , the annual salary
Explanation Verified
(a) Scatter Diagram:
![]() The above scatte...
The above scatte...
Understanding Basic Statistics 6th Edition by Charles Henry Brase,Corrinne Pellillo Brase
Why don’t you like this exercise?
Other Minimum 8 character and maximum 255 character
Character 255


