
Understanding Basic Statistics 6th Edition by Charles Henry Brase,Corrinne Pellillo Brase
Edition 6ISBN: 978-1111827021Understanding Basic Statistics 6th Edition by Charles Henry Brase,Corrinne Pellillo Brase
Edition 6ISBN: 978-1111827021 Exercise 37
Critical Thinking: Interpreting Computer Printouts Refer to the description of a computer display for regression described in problem 5. The following minitab display gives information regarding the relationship between the body weight of a child (in kilograms) and the metabolic rate of the child (in 100kcal/24 hr). The data is based on information from The Merck Manual (a commonly used reference in medical schools and nursing programs).
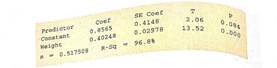
(a) Write out the least-squares equation.
(b) For each 1-kilogram increase in weight, how much does the metabolic rate of a child increase
(c) What is the value of the sample correlation coefficient r
(d) Interpretation What percentage of the variation in y can be explained by the corresponding variation in x and the least-squares line What percentage is unexplained
Explanation Verified
The Minitab output summarizes the linear...
Understanding Basic Statistics 6th Edition by Charles Henry Brase,Corrinne Pellillo Brase
Why don’t you like this exercise?
Other Minimum 8 character and maximum 255 character
Character 255


