
Understanding Basic Statistics 6th Edition by Charles Henry Brase,Corrinne Pellillo Brase
Edition 6ISBN: 978-1111827021Understanding Basic Statistics 6th Edition by Charles Henry Brase,Corrinne Pellillo Brase
Edition 6ISBN: 978-1111827021 Exercise 41
Draw a scatter diagram for the data.
(b) Find
 , b , and the equations of the least squares line. Plot the line on the scatter diagram of part (a).
(c) Find the sample correlation coefficient r and the coefficient of determination r 2. What percentage of variation is y is explained by the least-squares model
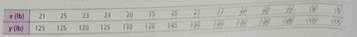
Medical: Fat Babies Modern medical practice tells us not to encourage babies to become too fat. Is there a positive correlation between the weight x of a 1-year old baby and the weight y of the mature adult (30 years old) A random sample of medical files produced the following information for 14 females.
Complete parts (a) through (c), given
x = 300; y = 1775; x 2 = 6572; y 2 = 226,125; xy = 38,220
(d) If a female baby weight 20 pounds at 1 year what do you predict she will weight at 30 years of age
(b) Find
, b , and the equations of the least squares line. Plot the line on the scatter diagram of part (a).(c) Find the sample correlation coefficient r and the coefficient of determination r 2. What percentage of variation is y is explained by the least-squares model
Medical: Fat Babies Modern medical practice tells us not to encourage babies to become too fat. Is there a positive correlation between the weight x of a 1-year old baby and the weight y of the mature adult (30 years old) A random sample of medical files produced the following information for 14 females.
Complete parts (a) through (c), given
x = 300; y = 1775; x 2 = 6572; y 2 = 226,125; xy = 38,220
(d) If a female baby weight 20 pounds at 1 year what do you predict she will weight at 30 years of age
Explanation Verified
(a) Scatter Diagram:
![]() The above scatte...
The above scatte...
Understanding Basic Statistics 6th Edition by Charles Henry Brase,Corrinne Pellillo Brase
Why don’t you like this exercise?
Other Minimum 8 character and maximum 255 character
Character 255


