
Understanding Basic Statistics 6th Edition by Charles Henry Brase,Corrinne Pellillo Brase
Edition 6ISBN: 978-1111827021Understanding Basic Statistics 6th Edition by Charles Henry Brase,Corrinne Pellillo Brase
Edition 6ISBN: 978-1111827021 Exercise 45
Draw a scatter diagram displaying the data.
(b) Verify the given sums x , y , x 2 , y 2 , and xy , and the value of the sample correlation coefficient r.
(c) Find
 , a , and b. Then find the equation of the least-squares line = a + bx.
(d) Graph the least-squares line on your scatter diagram. Be sure to use the point(
 ) as one of the points on the line.
(e) Interpretation Find the value of the coefficient of determination r 2. What percentage of the variation in y can be explained by the corresponding variation in x and the least-squares line What percentage is unexplained Answers may vary slightly due to rounding.
Economics: Entry-Level jobs An economist is studying the job market in Denver area neighborhoods. Let x represent the total number of jobs in a given neighborhood, and let y represent the number of entry-level jobs in the same neighborhood. A sample of six Denver neighborhoods gave the following information (units in hundreds of jobs).
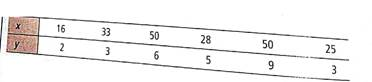
Complete parts (a) through (e), given x = 202, y = 28, x 2 = 7754, y 2 = 164, xy = 1096, and r 0.860.
(f) For a neighborhood with x = 40 jobs, how many are predicted to be entry-level jobs
(b) Verify the given sums x , y , x 2 , y 2 , and xy , and the value of the sample correlation coefficient r.
(c) Find
, a , and b. Then find the equation of the least-squares line = a + bx. (d) Graph the least-squares line on your scatter diagram. Be sure to use the point(
) as one of the points on the line.(e) Interpretation Find the value of the coefficient of determination r 2. What percentage of the variation in y can be explained by the corresponding variation in x and the least-squares line What percentage is unexplained Answers may vary slightly due to rounding.
Economics: Entry-Level jobs An economist is studying the job market in Denver area neighborhoods. Let x represent the total number of jobs in a given neighborhood, and let y represent the number of entry-level jobs in the same neighborhood. A sample of six Denver neighborhoods gave the following information (units in hundreds of jobs).
Complete parts (a) through (e), given x = 202, y = 28, x 2 = 7754, y 2 = 164, xy = 1096, and r 0.860.
(f) For a neighborhood with x = 40 jobs, how many are predicted to be entry-level jobs
Explanation Verified
(a) Scatter Diagram:
![]() • The above scat...
• The above scat...
Understanding Basic Statistics 6th Edition by Charles Henry Brase,Corrinne Pellillo Brase
Why don’t you like this exercise?
Other Minimum 8 character and maximum 255 character
Character 255


