
Understanding Basic Statistics 6th Edition by Charles Henry Brase,Corrinne Pellillo Brase
Edition 6ISBN: 978-1111827021Understanding Basic Statistics 6th Edition by Charles Henry Brase,Corrinne Pellillo Brase
Edition 6ISBN: 978-1111827021 Exercise 49
Draw a scatter diagram for the data.
(b) Find
 , b , and the equations of the least squares line. Plot the line on the scatter diagram of part (a).
(c) Find the sample correlation coefficient r and the coefficient of determination r 2. What percentage of variation is y is explained by the least-squares model
Sales: Insurance Dorothy Kelly sells life insurance for the Prudence Insurance Company. She sells insurance by making visits to her clients' homes. Dorothy believes that the number of sales should depend, to some degree, on the number of visits made. For the past several years, she kept careful records of the number of visits ( x ) she made each week and the number of people ( y ) who buy insurance that week. For a random sample of 15 such weeks, the x and y values follow.
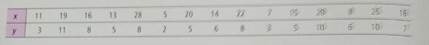
Complete parts (a) through (c), given
x = 248; y = 97; x 2 = 4856; y 2 = 731; xy = 1825
(d) In a week during which Dorothy makes 18 visits, how many people do you predict will buy insurance from her
(b) Find
, b , and the equations of the least squares line. Plot the line on the scatter diagram of part (a).(c) Find the sample correlation coefficient r and the coefficient of determination r 2. What percentage of variation is y is explained by the least-squares model
Sales: Insurance Dorothy Kelly sells life insurance for the Prudence Insurance Company. She sells insurance by making visits to her clients' homes. Dorothy believes that the number of sales should depend, to some degree, on the number of visits made. For the past several years, she kept careful records of the number of visits ( x ) she made each week and the number of people ( y ) who buy insurance that week. For a random sample of 15 such weeks, the x and y values follow.
Complete parts (a) through (c), given
x = 248; y = 97; x 2 = 4856; y 2 = 731; xy = 1825
(d) In a week during which Dorothy makes 18 visits, how many people do you predict will buy insurance from her
Explanation Verified
(a) Scatter Diagram:
![]() The above scatte...
The above scatte...
Understanding Basic Statistics 6th Edition by Charles Henry Brase,Corrinne Pellillo Brase
Why don’t you like this exercise?
Other Minimum 8 character and maximum 255 character
Character 255


