
Understanding Basic Statistics 6th Edition by Charles Henry Brase,Corrinne Pellillo Brase
Edition 6ISBN: 978-1111827021Understanding Basic Statistics 6th Edition by Charles Henry Brase,Corrinne Pellillo Brase
Edition 6ISBN: 978-1111827021 Exercise 53
Draw a scatter diagram displaying the data.
(b) Verify the given sums x , y , x 2 , y 2 , and xy , and the value of the sample correlation coefficient r.
(c) Find
 , a , and b. Then find the equation of the least-squares line = a + bx.
(d) Graph the least-squares line on your scatter diagram. Be sure to use the point(
 ) as one of the points on the line.
(e) Interpretation Find the value of the coefficient of determination r 2. What percentage of the variation in y can be explained by the corresponding variation in x and the least-squares line What percentage is unexplained Answers may vary slightly due to rounding.
Ranching: Cattle You are the foreman of the Bar-S cattle ranch in Colorado. A neighboring ranch has calves for sale, and you are going to buy some calves to add to the Bar-S herd. How much should a healthy calf weigh Let x be the age of the calf (in weeks), and let y be the weight of the calf (in kilograms). The following information is based on data taken from The Merck Veterinary Manual (a reference used by many renchers).
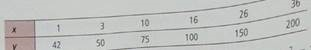
Complete parts (a) through (e), given x = 92, y = 617, x 2 = 2338, y 2 = 82,389, xy = 13,642, and r 0.998.
(f) The calves you want to buy are 12 weeks old. What does the least-squares line predict for a healthy weight
(b) Verify the given sums x , y , x 2 , y 2 , and xy , and the value of the sample correlation coefficient r.
(c) Find
, a , and b. Then find the equation of the least-squares line = a + bx.(d) Graph the least-squares line on your scatter diagram. Be sure to use the point(
) as one of the points on the line.(e) Interpretation Find the value of the coefficient of determination r 2. What percentage of the variation in y can be explained by the corresponding variation in x and the least-squares line What percentage is unexplained Answers may vary slightly due to rounding.
Ranching: Cattle You are the foreman of the Bar-S cattle ranch in Colorado. A neighboring ranch has calves for sale, and you are going to buy some calves to add to the Bar-S herd. How much should a healthy calf weigh Let x be the age of the calf (in weeks), and let y be the weight of the calf (in kilograms). The following information is based on data taken from The Merck Veterinary Manual (a reference used by many renchers).
Complete parts (a) through (e), given x = 92, y = 617, x 2 = 2338, y 2 = 82,389, xy = 13,642, and r 0.998.
(f) The calves you want to buy are 12 weeks old. What does the least-squares line predict for a healthy weight
Explanation Verified
(a)
Scatter Diagram:
![]() • The above scat...
• The above scat...
Understanding Basic Statistics 6th Edition by Charles Henry Brase,Corrinne Pellillo Brase
Why don’t you like this exercise?
Other Minimum 8 character and maximum 255 character
Character 255


