
Understanding Basic Statistics 6th Edition by Charles Henry Brase,Corrinne Pellillo Brase
Edition 6ISBN: 978-1111827021Understanding Basic Statistics 6th Edition by Charles Henry Brase,Corrinne Pellillo Brase
Edition 6ISBN: 978-1111827021 Exercise 6
Draw a scatter diagram displaying the data.
(b) Verify the given sums x , y , x 2 , y 2 , and xy , and the value of the sample correlation coefficient r.
(c) Find
 , a , and b. Then find the equation of the least-squares line = a + bx.
(d) Graph the least-squares line on your scatter diagram. Be sure to use the point(
 ) as one of the points on the line.
(e) Interpretation Find the value of the coefficient of determination r 2. What percentage of the variation in y can be explained by the corresponding variation in x and the least-squares line What percentage is unexplained Answers may vary slightly due to rounding.
Weight of Car: Miles per Gallon Do heavier cars really use more gasoline Suppose a car is chosen at random. Let x be the weight of the car (in hundreds of pounds), and let y be the miles per gallon (mpg). The following information is based on data taken from Consumer Reports (Vol. 62, N0 4).
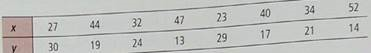
Complete parts (a) through (e), given x = 299, y = 167, x ² = 11,887, y ² = 3773, xy = 5814 and r -0.946.
f) Suppose a car weighs x = 38 (hundred pounds). What does the least-squares line forecast for y = miles per gallon
(b) Verify the given sums x , y , x 2 , y 2 , and xy , and the value of the sample correlation coefficient r.
(c) Find
, a , and b. Then find the equation of the least-squares line = a + bx.(d) Graph the least-squares line on your scatter diagram. Be sure to use the point(
) as one of the points on the line.(e) Interpretation Find the value of the coefficient of determination r 2. What percentage of the variation in y can be explained by the corresponding variation in x and the least-squares line What percentage is unexplained Answers may vary slightly due to rounding.
Weight of Car: Miles per Gallon Do heavier cars really use more gasoline Suppose a car is chosen at random. Let x be the weight of the car (in hundreds of pounds), and let y be the miles per gallon (mpg). The following information is based on data taken from Consumer Reports (Vol. 62, N0 4).
Complete parts (a) through (e), given x = 299, y = 167, x ² = 11,887, y ² = 3773, xy = 5814 and r -0.946.
f) Suppose a car weighs x = 38 (hundred pounds). What does the least-squares line forecast for y = miles per gallon
Explanation Verified
(a)
Scatter Diagram:
![]() • The above scat...
• The above scat...
Understanding Basic Statistics 6th Edition by Charles Henry Brase,Corrinne Pellillo Brase
Why don’t you like this exercise?
Other Minimum 8 character and maximum 255 character
Character 255


