
Understanding Basic Statistics 6th Edition by Charles Henry Brase,Corrinne Pellillo Brase
Edition 6ISBN: 978-1111827021Understanding Basic Statistics 6th Edition by Charles Henry Brase,Corrinne Pellillo Brase
Edition 6ISBN: 978-1111827021 Exercise 9
Draw a scatter diagram for the data.
(b) Find
 , b , and the equations of the least squares line. Plot the line on the scatter diagram of part (a).
(c) Find the sample correlation coefficient r and the coefficient of determination r 2. What percentage of variation is y is explained by the least-squares model
Focus Problem: Changing Population and Cone Rate Let x be a random variable representing percentage change in neighborhood population in the past few years, and let y be a random variable representing crime rate (crimes per 1000 population). A random sample of six Denver neighborhoods gave the following information. (Source: Neighborhood Facts, The piton Foundation).
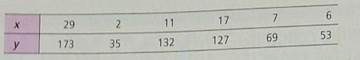
Complete parts (a) through (c), given
x = 72; y = 589; x 2 = 1340; y 2 = 72,277; xy = 9499
(d) For a neighborhood with x = 12% change in population in the past few years, predict the change in the crime rate (per 1000 residents).
(b) Find
, b , and the equations of the least squares line. Plot the line on the scatter diagram of part (a).(c) Find the sample correlation coefficient r and the coefficient of determination r 2. What percentage of variation is y is explained by the least-squares model
Focus Problem: Changing Population and Cone Rate Let x be a random variable representing percentage change in neighborhood population in the past few years, and let y be a random variable representing crime rate (crimes per 1000 population). A random sample of six Denver neighborhoods gave the following information. (Source: Neighborhood Facts, The piton Foundation).
Complete parts (a) through (c), given
x = 72; y = 589; x 2 = 1340; y 2 = 72,277; xy = 9499
(d) For a neighborhood with x = 12% change in population in the past few years, predict the change in the crime rate (per 1000 residents).
Explanation Verified
(a) Scatter Diagram:
![]() The above scatte...
The above scatte...
Understanding Basic Statistics 6th Edition by Charles Henry Brase,Corrinne Pellillo Brase
Why don’t you like this exercise?
Other Minimum 8 character and maximum 255 character
Character 255


