
Understanding Basic Statistics 6th Edition by Charles Henry Brase,Corrinne Pellillo Brase
Edition 6ISBN: 978-1111827021Understanding Basic Statistics 6th Edition by Charles Henry Brase,Corrinne Pellillo Brase
Edition 6ISBN: 978-1111827021 Exercise 18
Draw a scatter diagram displaying the data.
(b) Verify the given sums x , y , x 2 , y 2 , and xy , and the value of the sample correlation coefficient r.
(c) Find
 , a , and b. Then find the equation of the least-squares line = a + bx.
(d) Graph the least-squares line on your scatter diagram. Be sure to use the point(
 ) as one of the points on the line.
(e) Interpretation Find the value of the coefficient of determination r 2. What percentage of the variation in y can be explained by the corresponding variation in x and the least-squares line What percentage is unexplained Answers may vary slightly due to rounding.
Auto Accidents: Age Let x be the age of a licensed driver in years. Let y be the percentage of all fatal accidents (for a given age) due to failure to yield the right of way. For example, the first data pair states that 5% of all fatal accidents of 37-year-olds are due to failure to yield the right of way. The wall street Journal article referenced in problem 11 reported the following data:
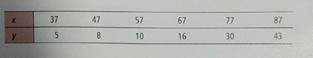
Complete parts (a) through (e), given x = 372, y = 112, x ² = 24,814, y ² = 3194, xy = 8254, and r 0.943.
(f) Predict the percentage of all fatal accidents due to failing to yield the right-of-way for 70-year-olds.
(b) Verify the given sums x , y , x 2 , y 2 , and xy , and the value of the sample correlation coefficient r.
(c) Find
, a , and b. Then find the equation of the least-squares line = a + bx.(d) Graph the least-squares line on your scatter diagram. Be sure to use the point(
) as one of the points on the line.(e) Interpretation Find the value of the coefficient of determination r 2. What percentage of the variation in y can be explained by the corresponding variation in x and the least-squares line What percentage is unexplained Answers may vary slightly due to rounding.
Auto Accidents: Age Let x be the age of a licensed driver in years. Let y be the percentage of all fatal accidents (for a given age) due to failure to yield the right of way. For example, the first data pair states that 5% of all fatal accidents of 37-year-olds are due to failure to yield the right of way. The wall street Journal article referenced in problem 11 reported the following data:
Complete parts (a) through (e), given x = 372, y = 112, x ² = 24,814, y ² = 3194, xy = 8254, and r 0.943.
(f) Predict the percentage of all fatal accidents due to failing to yield the right-of-way for 70-year-olds.
Explanation Verified
(a) Scatter Diagram:
![]() • The above scat...
• The above scat...
Understanding Basic Statistics 6th Edition by Charles Henry Brase,Corrinne Pellillo Brase
Why don’t you like this exercise?
Other Minimum 8 character and maximum 255 character
Character 255


