
Understanding Basic Statistics 6th Edition by Charles Henry Brase,Corrinne Pellillo Brase
Edition 6ISBN: 978-1111827021Understanding Basic Statistics 6th Edition by Charles Henry Brase,Corrinne Pellillo Brase
Edition 6ISBN: 978-1111827021 Exercise 34
Draw a scatter diagram displaying the data.
(b) Verify the given sums x , y , x 2 , y 2 , and xy , and the value of the sample correlation coefficient r.
(c) Find
 , a , and b. Then find the equation of the least-squares line = a + bx.
(d) Graph the least-squares line on your scatter diagram. Be sure to use the point(
 ) as one of the points on the line.
(e) Interpretation Find the value of the coefficient of determination r 2. What percentage of the variation in y can be explained by the corresponding variation in x and the least-squares line What percentage is unexplained Answers may vary slightly due to rounding.
Archaeology: Artifacts Data for this problem are based in information taken from Prechistoric New Mexico: Background for survey (by D. E. Stuart and R. P. Gauthier, University of New Mexico Press). It is thought that prechistroric Indians did not take their best tools, pottery, and household items when they visited higher elevation of the site increases. Let x be the elevation (in thousands of feet) of an archaeological site in the southwestern United States. Let y be the percentage of unidentified artifacts (no specific cultural affiliation) at a given elevation. The following data were obtained for a collection of archaeological sites in New Mexico:
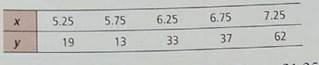
Complete parts (a) through (e), given x = 31.25, y = 164, x ² = 197.813, y ² = 6832, xy = 1080, and r 0.913.
(f) At an archaeological site with elevation 6.5 (thousand feet), What does the least-squares equation forecast for y = Percentage of culturally unidentified artifacts
(b) Verify the given sums x , y , x 2 , y 2 , and xy , and the value of the sample correlation coefficient r.
(c) Find
, a , and b. Then find the equation of the least-squares line = a + bx.(d) Graph the least-squares line on your scatter diagram. Be sure to use the point(
) as one of the points on the line.(e) Interpretation Find the value of the coefficient of determination r 2. What percentage of the variation in y can be explained by the corresponding variation in x and the least-squares line What percentage is unexplained Answers may vary slightly due to rounding.
Archaeology: Artifacts Data for this problem are based in information taken from Prechistoric New Mexico: Background for survey (by D. E. Stuart and R. P. Gauthier, University of New Mexico Press). It is thought that prechistroric Indians did not take their best tools, pottery, and household items when they visited higher elevation of the site increases. Let x be the elevation (in thousands of feet) of an archaeological site in the southwestern United States. Let y be the percentage of unidentified artifacts (no specific cultural affiliation) at a given elevation. The following data were obtained for a collection of archaeological sites in New Mexico:
Complete parts (a) through (e), given x = 31.25, y = 164, x ² = 197.813, y ² = 6832, xy = 1080, and r 0.913.
(f) At an archaeological site with elevation 6.5 (thousand feet), What does the least-squares equation forecast for y = Percentage of culturally unidentified artifacts
Explanation Verified
(a) Scatter Diagram:
![]() • The above scat...
• The above scat...
Understanding Basic Statistics 6th Edition by Charles Henry Brase,Corrinne Pellillo Brase
Why don’t you like this exercise?
Other Minimum 8 character and maximum 255 character
Character 255


