
Understanding Basic Statistics 6th Edition by Charles Henry Brase,Corrinne Pellillo Brase
Edition 6ISBN: 978-1111827021Understanding Basic Statistics 6th Edition by Charles Henry Brase,Corrinne Pellillo Brase
Edition 6ISBN: 978-1111827021 Exercise 38
Draw a scatter diagram displaying the data.
(b) Verify the given sums x , y , x 2 , y 2 , and xy , and the value of the sample correlation coefficient r.
(c) Find
 , a , and b. Then find the equation of the least-squares line = a + bx.
(d) Graph the least-squares line on your scatter diagram. Be sure to use the point(
 ) as one of the points on the line.
(e) Interpretation Find the value of the coefficient of determination r 2. What percentage of the variation in y can be explained by the corresponding variation in x and the least-squares line What percentage is unexplained Answers may vary slightly due to rounding.
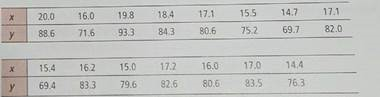
Cricket Chirps: Temperature Anyone who has been outdoors on summer evening has probably heard crickets. Did you know that it is possible to use the cricket as a thermometer Crickets tend to chirp more frequently as temperatures increase. This Phenomenon was studied in details by George W. Pierce, a physics professor at Harvard. In the following data, x is a random variable representing chirps per second and y isarandom variable representing temperature (F). These data are also available for downloadat the Online study Center.
Source: Reprinted by permission of the publisher from The songs of insects by George W. Pierce, Cambridge, Mass: Harvard University press, Copyright © 1948 by the president and follows of Harvard college.
Complete parts (a) through (e), given x = 249.8, y = 1200.6, x ² = 4200.56, y ² = 96,725.86, xy = 20,127.47, and r 0.835.
(f) What is the predicted temperature when x = 19 chirps per second
(b) Verify the given sums x , y , x 2 , y 2 , and xy , and the value of the sample correlation coefficient r.
(c) Find
, a , and b. Then find the equation of the least-squares line = a + bx.(d) Graph the least-squares line on your scatter diagram. Be sure to use the point(
) as one of the points on the line.(e) Interpretation Find the value of the coefficient of determination r 2. What percentage of the variation in y can be explained by the corresponding variation in x and the least-squares line What percentage is unexplained Answers may vary slightly due to rounding.
Cricket Chirps: Temperature Anyone who has been outdoors on summer evening has probably heard crickets. Did you know that it is possible to use the cricket as a thermometer Crickets tend to chirp more frequently as temperatures increase. This Phenomenon was studied in details by George W. Pierce, a physics professor at Harvard. In the following data, x is a random variable representing chirps per second and y isarandom variable representing temperature (F). These data are also available for downloadat the Online study Center.
Source: Reprinted by permission of the publisher from The songs of insects by George W. Pierce, Cambridge, Mass: Harvard University press, Copyright © 1948 by the president and follows of Harvard college.
Complete parts (a) through (e), given x = 249.8, y = 1200.6, x ² = 4200.56, y ² = 96,725.86, xy = 20,127.47, and r 0.835.
(f) What is the predicted temperature when x = 19 chirps per second
Explanation Verified
(a) Scatter Diagram:
![]() • The above scat...
• The above scat...
Understanding Basic Statistics 6th Edition by Charles Henry Brase,Corrinne Pellillo Brase
Why don’t you like this exercise?
Other Minimum 8 character and maximum 255 character
Character 255


