
Understanding Basic Statistics 6th Edition by Charles Henry Brase,Corrinne Pellillo Brase
Edition 6ISBN: 978-1111827021Understanding Basic Statistics 6th Edition by Charles Henry Brase,Corrinne Pellillo Brase
Edition 6ISBN: 978-1111827021 Exercise 54
Fishing: Trout The following data are based on information taken from Daily Creel Summary published by the Paiute Indian Nation, Pyramid Lake, Nevad. Movie stars and U.S. presidents have fished Pyramid Lake. It is one of the best places in the lower 48 states to catch trophy cutthroat trout. In this table, x = number of fish caught in 6-hour period. The percentage data are the percentages of fishermen who catch x fish in a 6-hour period while fishing from shore.
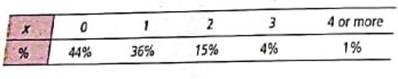
(a) Convert the percentages to probabilities and make a histogram of the probability districution.
(b) Find the probability that a fisherman selected at random fishing from shore catches one or more fish in a 6-hour period.
(c) Find the probability that a fisherman selected at random fishing from shore catches two or more fish in a 6-hour period.
(d) Compute , the expected value of the number of fish caught per fisherman in a 6-hour period (round 4 or more to 4)
(e) Compute , the standard deviation of the number of fish caught per fisherman in a 6-hour period (round 4 or more to 4).
Explanation Verified
We are given data on the number of fish ...
Understanding Basic Statistics 6th Edition by Charles Henry Brase,Corrinne Pellillo Brase
Why don’t you like this exercise?
Other Minimum 8 character and maximum 255 character
Character 255


