
Understanding Basic Statistics 6th Edition by Charles Henry Brase,Corrinne Pellillo Brase
Edition 6ISBN: 978-1111827021Understanding Basic Statistics 6th Edition by Charles Henry Brase,Corrinne Pellillo Brase
Edition 6ISBN: 978-1111827021 Exercise 77
Linear Regression: Blood Glucose Let x be a random variable that represents blood glucose level after a 12-hour fast. Let y be a random variable representing blood glucose level 1 hour alter drinking sugar water (after the 12-hour fast). Units are in mg/10 ml. A random sample of eight adults gave the following information (Reference: American Journal of Clinical Nutrition , Vol. 19. pp. 345-351).
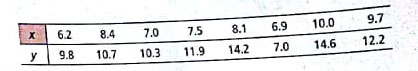
x = 63.8; x 2 = 521.56; y = 90.7;
y 2 = 1070.87; xy = 739.65
(a) Draw a scatter diagram for the data.
(b) Find the equation of the least-squares line and graph it on the scatter diagram.
(c) Find the sample correlation coefficient rand the sample coefficient of determination r 2. Explain the meaning of r 2 in the context of the application.
(d) If x = 9.0, use the least-squares line to predict y.
Explanation Verified
(a) Scatter Diagram:
![]() The above scatte...
The above scatte...
Understanding Basic Statistics 6th Edition by Charles Henry Brase,Corrinne Pellillo Brase
Why don’t you like this exercise?
Other Minimum 8 character and maximum 255 character
Character 255


