
Understanding Basic Statistics 6th Edition by Charles Henry Brase,Corrinne Pellillo Brase
Edition 6ISBN: 978-1111827021Understanding Basic Statistics 6th Edition by Charles Henry Brase,Corrinne Pellillo Brase
Edition 6ISBN: 978-1111827021 Exercise 59
Finance: P/E Ratio The price of a share of stock divided by a company's estimated future earnings per share is called the P/E ratio. High P/E, ratios usually indicate "growth" stocks, or maybe stocks that are simply overpriced. Low P/E ratios indicate "value" stocks or bargain stocks. A random sample of 51 of the largest companies in the United States gave the following P/E ratios (Reference: Forbes ).
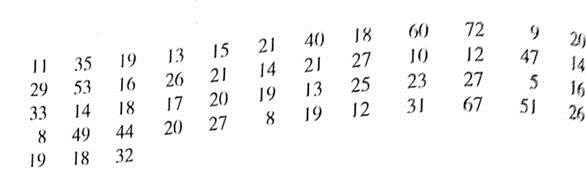
(a) Use a calculator with mean and sample standard deviation keys to verify that
 25.2 and s 15.5.
(b) Find a 90% confidence interval for the P/E population mean of all large U.S. companies.
(c) Find a 99% confidence interval for the P/E population mean of all large U.S. companies.
(d) Interpretation Bank One (now merged with J.P Morgan) had a P/E of 12, AT T Wireless had a P/E of 72, and Disney had a P/E of 24. Examine the confidence intervals in parts (b) and (c). How would you describe these stocks at the time the sample was taken
(e) Check Requirements In previous problems, we assumed the x distribution was normal or approximately normal. Do we need to make such an assumption in this problem Why or why not Hint: See the central limit theorem in Section 7.5.
(a) Use a calculator with mean and sample standard deviation keys to verify that
25.2 and s 15.5.(b) Find a 90% confidence interval for the P/E population mean of all large U.S. companies.
(c) Find a 99% confidence interval for the P/E population mean of all large U.S. companies.
(d) Interpretation Bank One (now merged with J.P Morgan) had a P/E of 12, AT T Wireless had a P/E of 72, and Disney had a P/E of 24. Examine the confidence intervals in parts (b) and (c). How would you describe these stocks at the time the sample was taken
(e) Check Requirements In previous problems, we assumed the x distribution was normal or approximately normal. Do we need to make such an assumption in this problem Why or why not Hint: See the central limit theorem in Section 7.5.
Explanation Verified
(a)
For the given data the sample mean i...
Understanding Basic Statistics 6th Edition by Charles Henry Brase,Corrinne Pellillo Brase
Why don’t you like this exercise?
Other Minimum 8 character and maximum 255 character
Character 255


