
Understanding Basic Statistics 6th Edition by Charles Henry Brase,Corrinne Pellillo Brase
Edition 6ISBN: 978-1111827021Understanding Basic Statistics 6th Edition by Charles Henry Brase,Corrinne Pellillo Brase
Edition 6ISBN: 978-1111827021 Exercise 64
Baseball: Home Run Percentage The home run percentage is the number of home runs per 100 times at bat. A random sample of 43 professional baseball players gave the following data for home run percentages (Reference: The Baseball Encyclopedia, Macmillan).
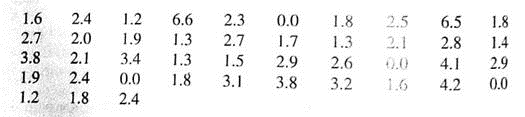
(a) Use a calculator with mean and sample standard deviation keys to verify that
 2.29 and s 1.40.
(b) Compute a 90% confidence interval for the population mean of home run percentages for all professional baseball players. Hint: If you use Table 4 of the Appendix, be sure to use the closest d.f. that is smaller.
(c) Compute a 99% confidence interval for the population mean of home run percentages for all professional baseball players.
(d) Interpretation The home run percentages for three professional players are
Tim Huelett, 2.5 Herb Hunter, 2.0 Jackie Jensen, 3.8
Examine your confidence intervals and describe how the home run percentages for these players compare to the population average.
(e) Check Requirements In previous problems, we assumed the x distribution was normal or approximately normal. Do we need to make such an assumption in this problem Why or why not Hint: See the central limit theorem in Section 7.5.
(a) Use a calculator with mean and sample standard deviation keys to verify that
2.29 and s 1.40.(b) Compute a 90% confidence interval for the population mean of home run percentages for all professional baseball players. Hint: If you use Table 4 of the Appendix, be sure to use the closest d.f. that is smaller.
(c) Compute a 99% confidence interval for the population mean of home run percentages for all professional baseball players.
(d) Interpretation The home run percentages for three professional players are
Tim Huelett, 2.5 Herb Hunter, 2.0 Jackie Jensen, 3.8
Examine your confidence intervals and describe how the home run percentages for these players compare to the population average.
(e) Check Requirements In previous problems, we assumed the x distribution was normal or approximately normal. Do we need to make such an assumption in this problem Why or why not Hint: See the central limit theorem in Section 7.5.
Explanation Verified
(a)
For the given data the sample mean ...
Understanding Basic Statistics 6th Edition by Charles Henry Brase,Corrinne Pellillo Brase
Why don’t you like this exercise?
Other Minimum 8 character and maximum 255 character
Character 255


