
Understanding Basic Statistics 6th Edition by Charles Henry Brase,Corrinne Pellillo Brase
Edition 6ISBN: 978-1111827021Understanding Basic Statistics 6th Edition by Charles Henry Brase,Corrinne Pellillo Brase
Edition 6ISBN: 978-1111827021 Exercise 15
Provide the following information
(a) What is the level of significance State the null and alternate hypotheses.
(b) Check Requirements What sampling distribution will you use Explain the rationale for your choice of sampling distribution. Compute the value of the sample test statistic.
(c) Find (or estimate) the P -value. Sketch the sampling distribution and show the area corresponding to the P -value.
(d) Based on you answers in part (a) to (c), will you reject or fail to reject the null hypothesis Are the data statistically significant at level
(e) Interpret your conclusion in the context of the application.
Note: For degree of freedom d.f. not given in the Student's t table, use the closest d.f. that is smaller. In some situations, this choice of d.f. may increase the P -value by a small amount and therefore produce a slightly more "conservative" answer.
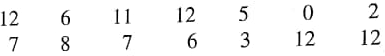
Fishing: Atlantic Salmon Homser Lake, Oregon, has an Atlantic salmon catch and release program that has been very successful. The average fisherman's catch has been = 8.8 Atlantic salmon per day (Source: National Symposium on Catch and Release Fishing , Humboldt State University). Suppose that a new quota system restricting the number of fishermen has been put into effect this season. A random sample of fishermen gave the following catches per day:
i. Use a calculator with mean and sample standard deviation keys to verify that
 = 7.36 and s 4.03.
ii Assuming the catch per days has an approximately normal distribution, use a 5% level of significance to test the claim that the population average catch per day is now different from 8.8.
(a) What is the level of significance State the null and alternate hypotheses.
(b) Check Requirements What sampling distribution will you use Explain the rationale for your choice of sampling distribution. Compute the value of the sample test statistic.
(c) Find (or estimate) the P -value. Sketch the sampling distribution and show the area corresponding to the P -value.
(d) Based on you answers in part (a) to (c), will you reject or fail to reject the null hypothesis Are the data statistically significant at level
(e) Interpret your conclusion in the context of the application.
Note: For degree of freedom d.f. not given in the Student's t table, use the closest d.f. that is smaller. In some situations, this choice of d.f. may increase the P -value by a small amount and therefore produce a slightly more "conservative" answer.
Fishing: Atlantic Salmon Homser Lake, Oregon, has an Atlantic salmon catch and release program that has been very successful. The average fisherman's catch has been = 8.8 Atlantic salmon per day (Source: National Symposium on Catch and Release Fishing , Humboldt State University). Suppose that a new quota system restricting the number of fishermen has been put into effect this season. A random sample of fishermen gave the following catches per day:
i. Use a calculator with mean and sample standard deviation keys to verify that
= 7.36 and s 4.03.ii Assuming the catch per days has an approximately normal distribution, use a 5% level of significance to test the claim that the population average catch per day is now different from 8.8.
Explanation Verified
(i)
We calculated that
![]() =7.3571 and s ...
=7.3571 and s ...
Understanding Basic Statistics 6th Edition by Charles Henry Brase,Corrinne Pellillo Brase
Why don’t you like this exercise?
Other Minimum 8 character and maximum 255 character
Character 255


