
Understanding Basic Statistics 6th Edition by Charles Henry Brase,Corrinne Pellillo Brase
Edition 6ISBN: 978-1111827021Understanding Basic Statistics 6th Edition by Charles Henry Brase,Corrinne Pellillo Brase
Edition 6ISBN: 978-1111827021 Exercise 35
Use the following steps (i)-(v) for all hypothesis tests:
(i) What is the level of significance State the null and alternate hypotheses.
(ii) Check Requirements What sampling distribution will you use What assumptions are you making What is the value of the sample test statistic
(iii) Find (or estimate) the P -value. Sketch the sampling distribution and show the area corresponding to the P -value.
(iv) Based on your answers in parts (i)-(iii), will you reject or fail to reject the null hypothesis Are the data statistically significant at level a
(v) Interpret your conclusion in the context of the application.
Note: For degree of freedom d.f. not in the Student's t table, use the closest d.f. that is smaller. In some situations, this choice of d.f. may increase the P -value a small amount and thereby produce a slightly more "conservative" answer.
Testing and Estimating µ with Unknown Carboxy-hemoglobin is formed when hemoglobin is exposed carbon monoxide. Heavy smokers tend to have a high percentage of carboxyhemoglobin in their blood (Reference: A Manual of Laboratory and Diagnostic Tests by F. Fischbach). Let x be a random variable representing percentage of carboxyhemoglobin in the blood. For a person who is a regular heavy smoker, x has a distribution that is approximately normal. A random sample of n = 12 blood tests given to a heavy smoker gave the following results (percentage of carboxyhemoglobin in the blood):
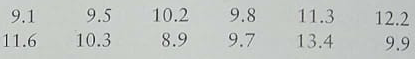 (a) Use a calculator to verify that
 10.49 and s 1.36.
(b) a long-term population mean µ = 10% is considered a health risk. However, a long-term population mean above 10% is considered a clinical alert that the person may be asymptomatic. Do the data indicate that the population mean percentage is higher than 10% for this patient Use = 0.05.
(c) Use the given data to find a 99% confidence interval for µ for this patient.
(i) What is the level of significance State the null and alternate hypotheses.
(ii) Check Requirements What sampling distribution will you use What assumptions are you making What is the value of the sample test statistic
(iii) Find (or estimate) the P -value. Sketch the sampling distribution and show the area corresponding to the P -value.
(iv) Based on your answers in parts (i)-(iii), will you reject or fail to reject the null hypothesis Are the data statistically significant at level a
(v) Interpret your conclusion in the context of the application.
Note: For degree of freedom d.f. not in the Student's t table, use the closest d.f. that is smaller. In some situations, this choice of d.f. may increase the P -value a small amount and thereby produce a slightly more "conservative" answer.
Testing and Estimating µ with Unknown Carboxy-hemoglobin is formed when hemoglobin is exposed carbon monoxide. Heavy smokers tend to have a high percentage of carboxyhemoglobin in their blood (Reference: A Manual of Laboratory and Diagnostic Tests by F. Fischbach). Let x be a random variable representing percentage of carboxyhemoglobin in the blood. For a person who is a regular heavy smoker, x has a distribution that is approximately normal. A random sample of n = 12 blood tests given to a heavy smoker gave the following results (percentage of carboxyhemoglobin in the blood):
(a) Use a calculator to verify that 10.49 and s 1.36.(b) a long-term population mean µ = 10% is considered a health risk. However, a long-term population mean above 10% is considered a clinical alert that the person may be asymptomatic. Do the data indicate that the population mean percentage is higher than 10% for this patient Use = 0.05.
(c) Use the given data to find a 99% confidence interval for µ for this patient.
Explanation Verified
(a) We are given n = 12 results for the ...
Understanding Basic Statistics 6th Edition by Charles Henry Brase,Corrinne Pellillo Brase
Why don’t you like this exercise?
Other Minimum 8 character and maximum 255 character
Character 255


