
Understanding Basic Statistics 6th Edition by Charles Henry Brase,Corrinne Pellillo Brase
Edition 6ISBN: 978-1111827021Understanding Basic Statistics 6th Edition by Charles Henry Brase,Corrinne Pellillo Brase
Edition 6ISBN: 978-1111827021 Exercise 21
For Problems 9-17 assume that the distribution of differences d is mound-shaped and symmetrical.
Please provide the following information for Problems 9-17.
(a) What is the level of significance State the null and alternate hypotheses. Will you use a left-tailed, right-tailed, or two-tailed test
(b) Check Requirements What sampling distribution will you use What assumptions are you making Compute the value of the sample test statistic.
(c) Find (or estimate) the P -value. Sketch the sampling distribution and show the area corresponding to the P -value.
(d) Based on your answers in parts (a)-(c), will you reject or fail to reject the null hypothesis Are the data statistically significant at level
(e) Interpret your conclusion in the context of the application.
In these problems, assume that the distribution of differences is approximately normal.
Note: For degrees of freedom d.f. not in the Student's t table, use the closest d.f. that is smaller. In some situations, this choice of d.f. may increase the P -value by a small amount and therefore produce a slightly more "conservative" answer.
Business: CEO Raises Are America's top chief executive officers (CEOs) really worth all that money One way to answer this question is to look at row B , the annual company percentage increase in revenue, versus row A , the CEO's annual percentage salary increase in that same company (Source: Forbes , Vol. 159, No. 10). A random sample of companies such as Deere Co., General Electric. Union Carbide, and Dow Chemical yielded the following data:
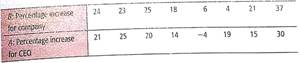
Do these data indicate that the population mean percentage increase in corporate revenue (row B ) is different from the population mean percentage increase in CEO salary Use a 5% level of significance.
Please provide the following information for Problems 9-17.
(a) What is the level of significance State the null and alternate hypotheses. Will you use a left-tailed, right-tailed, or two-tailed test
(b) Check Requirements What sampling distribution will you use What assumptions are you making Compute the value of the sample test statistic.
(c) Find (or estimate) the P -value. Sketch the sampling distribution and show the area corresponding to the P -value.
(d) Based on your answers in parts (a)-(c), will you reject or fail to reject the null hypothesis Are the data statistically significant at level
(e) Interpret your conclusion in the context of the application.
In these problems, assume that the distribution of differences is approximately normal.
Note: For degrees of freedom d.f. not in the Student's t table, use the closest d.f. that is smaller. In some situations, this choice of d.f. may increase the P -value by a small amount and therefore produce a slightly more "conservative" answer.
Business: CEO Raises Are America's top chief executive officers (CEOs) really worth all that money One way to answer this question is to look at row B , the annual company percentage increase in revenue, versus row A , the CEO's annual percentage salary increase in that same company (Source: Forbes , Vol. 159, No. 10). A random sample of companies such as Deere Co., General Electric. Union Carbide, and Dow Chemical yielded the following data:
Do these data indicate that the population mean percentage increase in corporate revenue (row B ) is different from the population mean percentage increase in CEO salary Use a 5% level of significance.
Explanation Verified
The objective is to test that the percen...
Understanding Basic Statistics 6th Edition by Charles Henry Brase,Corrinne Pellillo Brase
Why don’t you like this exercise?
Other Minimum 8 character and maximum 255 character
Character 255


