
Understanding Basic Statistics 6th Edition by Charles Henry Brase,Corrinne Pellillo Brase
Edition 6ISBN: 978-1111827021Understanding Basic Statistics 6th Edition by Charles Henry Brase,Corrinne Pellillo Brase
Edition 6ISBN: 978-1111827021 Exercise 46
For Problems 9-17 assume that the distribution of differences d is mound-shaped and symmetrical.
Please provide the following information for Problems 9-17.
(a) What is the level of significance State the null and alternate hypotheses. Will you use a left-tailed, right-tailed, or two-tailed test
(b) Check Requirements What sampling distribution will you use What assumptions are you making Compute the value of the sample test statistic.
(c) Find (or estimate) the P -value. Sketch the sampling distribution and show the area corresponding to the P -value.
(d) Based on your answers in parts (a)-(c), will you reject or fail to reject the null hypothesis Are the data statistically significant at level
(e) Interpret your conclusion in the context of the application.
In these problems, assume that the distribution of differences is approximately normal.
Note: For degrees of freedom d.f. not in the Student's t table, use the closest d.f. that is smaller. In some situations, this choice of d.f. may increase the P -value by a small amount and therefore produce a slightly more "conservative" answer.
Demographics: Birth Rate and Death Rate In the following data pairs, A represents birth rate and B represents death rate per 1000-resident population. The data are paired by counties in the Midwest. A random sample of 16 counties gave the following information (Reference: County and City Data Book , U.S. Department of Commerce):
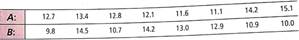
Do the data indicate a difference (either way) between population average birth rate and death rate in this region Use = 0.01.
Please provide the following information for Problems 9-17.
(a) What is the level of significance State the null and alternate hypotheses. Will you use a left-tailed, right-tailed, or two-tailed test
(b) Check Requirements What sampling distribution will you use What assumptions are you making Compute the value of the sample test statistic.
(c) Find (or estimate) the P -value. Sketch the sampling distribution and show the area corresponding to the P -value.
(d) Based on your answers in parts (a)-(c), will you reject or fail to reject the null hypothesis Are the data statistically significant at level
(e) Interpret your conclusion in the context of the application.
In these problems, assume that the distribution of differences is approximately normal.
Note: For degrees of freedom d.f. not in the Student's t table, use the closest d.f. that is smaller. In some situations, this choice of d.f. may increase the P -value by a small amount and therefore produce a slightly more "conservative" answer.
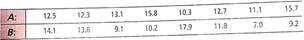
Demographics: Birth Rate and Death Rate In the following data pairs, A represents birth rate and B represents death rate per 1000-resident population. The data are paired by counties in the Midwest. A random sample of 16 counties gave the following information (Reference: County and City Data Book , U.S. Department of Commerce):
Do the data indicate a difference (either way) between population average birth rate and death rate in this region Use = 0.01.
Explanation Verified
a)
![]()
![]() We use the two-tailed test.
We use the two-tailed test.
b)
![]() F...
F...
Understanding Basic Statistics 6th Edition by Charles Henry Brase,Corrinne Pellillo Brase
Why don’t you like this exercise?
Other Minimum 8 character and maximum 255 character
Character 255


