
Understanding Basic Statistics 6th Edition by Charles Henry Brase,Corrinne Pellillo Brase
Edition 6ISBN: 978-1111827021Understanding Basic Statistics 6th Edition by Charles Henry Brase,Corrinne Pellillo Brase
Edition 6ISBN: 978-1111827021 Exercise 60
For Problems 9-17 assume that the distribution of differences d is mound-shaped and symmetrical.
Please provide the following information for Problems 9-17.
(a) What is the level of significance State the null and alternate hypotheses. Will you use a left-tailed, right-tailed, or two-tailed test
(b) Check Requirements What sampling distribution will you use What assumptions are you making Compute the value of the sample test statistic.
(c) Find (or estimate) the P -value. Sketch the sampling distribution and show the area corresponding to the P -value.
(d) Based on your answers in parts (a)-(c), will you reject or fail to reject the null hypothesis Are the data statistically significant at level
(e) Interpret your conclusion in the context of the application.
In these problems, assume that the distribution of differences is approximately normal.
Note: For degrees of freedom d.f. not in the Student's t table, use the closest d.f. that is smaller. In some situations, this choice of d.f. may increase the P -value by a small amount and therefore produce a slightly more "conservative" answer.
Economics: Cost of Living Index In the following data pairs, A represents the costs of living index for housing and B represents the cost of living index for groceries. The data are paired by metropolitan areas in the United States. A random sample of 36 metropolitan areas gave the following information (Reference: Statistical Abstract of the United States , 121st edition):
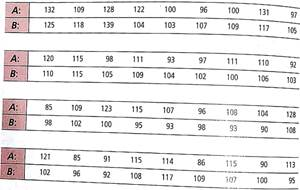
i. Let d be the random variable d = A - B. Use a calculator to verify that
 and s d 12.124.
ii. Do the data indicate that the U.S. population mean cost of living index for housing is higher than that for groceries in these areas Use = 0.05.
Please provide the following information for Problems 9-17.
(a) What is the level of significance State the null and alternate hypotheses. Will you use a left-tailed, right-tailed, or two-tailed test
(b) Check Requirements What sampling distribution will you use What assumptions are you making Compute the value of the sample test statistic.
(c) Find (or estimate) the P -value. Sketch the sampling distribution and show the area corresponding to the P -value.
(d) Based on your answers in parts (a)-(c), will you reject or fail to reject the null hypothesis Are the data statistically significant at level
(e) Interpret your conclusion in the context of the application.
In these problems, assume that the distribution of differences is approximately normal.
Note: For degrees of freedom d.f. not in the Student's t table, use the closest d.f. that is smaller. In some situations, this choice of d.f. may increase the P -value by a small amount and therefore produce a slightly more "conservative" answer.
Economics: Cost of Living Index In the following data pairs, A represents the costs of living index for housing and B represents the cost of living index for groceries. The data are paired by metropolitan areas in the United States. A random sample of 36 metropolitan areas gave the following information (Reference: Statistical Abstract of the United States , 121st edition):
i. Let d be the random variable d = A - B. Use a calculator to verify that
and s d 12.124.ii. Do the data indicate that the U.S. population mean cost of living index for housing is higher than that for groceries in these areas Use = 0.05.
Explanation Verified
(i)
![]() From the above table, we compute t...
From the above table, we compute t...
Understanding Basic Statistics 6th Edition by Charles Henry Brase,Corrinne Pellillo Brase
Why don’t you like this exercise?
Other Minimum 8 character and maximum 255 character
Character 255


