
Understanding Basic Statistics 6th Edition by Charles Henry Brase,Corrinne Pellillo Brase
Edition 6ISBN: 978-1111827021Understanding Basic Statistics 6th Edition by Charles Henry Brase,Corrinne Pellillo Brase
Edition 6ISBN: 978-1111827021 Exercise 13
Please provide the following information for Problems 11-22, part (a):
(i) What is the level of significance State the null and alternate hypotheses.
(ii) Check Requirements What sampling distribution will you use What assumptions are you making What is the value of the sample test statistic
(iii) Find (or estimate) the P -value. Sketch the sampling distribution and show the area corresponding to the P -value.
(iv) Based on your answers in parts (i) - (iii), will you reject or fail to reject the null hypothesis Are the data statistically significant at level a
(v) Interpret your conclusion in the context of the application.
Note: For degrees of freedom d.f. not in the Student's t table, use the closest d.f. that is smaller. In some situations, this choice of d.f. may increase the P -value a small amount, and therefore produce a slightly more "conservative" answer.
Answers may vary due to rounding.
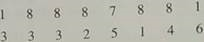
Wildlife: Fox Rabies A study of fox rabies in southern Germany gave information about different regions and the occurrence of rabies in each region (Reference: B. Sayers, et al., "A Pattern Analysis Study of a Wildlife Rabies Epizootic," Medical Informatics 2:11-34). Based on information from this article, a random sample of n 1 = 16 locations in region I gave the following information about the number of cases of fox rabies near that location:
x 1 : Region I data
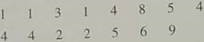
A second random sample of n 2 = 15 locations in region II gave the following information about the number of cases of fox rabies near that location:
x 2 : Region II data
Use a calculator with sample mean and sample standard deviation keys to verify that
 with s 1 2.82 in region I and
 with s 2 2.43in region II.
(a) Does this information indicate that there is a difference (either way) in the mean number of cases of fox rabies between the two regions Use a 5% level of significance (Assume the distribution of rabies cases in both regions is mound-shaped and approximately normal.)
(b) Find a 95% confidence interval for 1 2. Explain the meaning of the confidence interval in the context of the problem.
(i) What is the level of significance State the null and alternate hypotheses.
(ii) Check Requirements What sampling distribution will you use What assumptions are you making What is the value of the sample test statistic
(iii) Find (or estimate) the P -value. Sketch the sampling distribution and show the area corresponding to the P -value.
(iv) Based on your answers in parts (i) - (iii), will you reject or fail to reject the null hypothesis Are the data statistically significant at level a
(v) Interpret your conclusion in the context of the application.
Note: For degrees of freedom d.f. not in the Student's t table, use the closest d.f. that is smaller. In some situations, this choice of d.f. may increase the P -value a small amount, and therefore produce a slightly more "conservative" answer.
Answers may vary due to rounding.
Wildlife: Fox Rabies A study of fox rabies in southern Germany gave information about different regions and the occurrence of rabies in each region (Reference: B. Sayers, et al., "A Pattern Analysis Study of a Wildlife Rabies Epizootic," Medical Informatics 2:11-34). Based on information from this article, a random sample of n 1 = 16 locations in region I gave the following information about the number of cases of fox rabies near that location:
x 1 : Region I data
A second random sample of n 2 = 15 locations in region II gave the following information about the number of cases of fox rabies near that location:
x 2 : Region II data
Use a calculator with sample mean and sample standard deviation keys to verify that
with s 1 2.82 in region I and with s 2 2.43in region II.(a) Does this information indicate that there is a difference (either way) in the mean number of cases of fox rabies between the two regions Use a 5% level of significance (Assume the distribution of rabies cases in both regions is mound-shaped and approximately normal.)
(b) Find a 95% confidence interval for 1 2. Explain the meaning of the confidence interval in the context of the problem.
Explanation Verified
(a)
Let
![]() and
and
![]() be the means of the di...
be the means of the di...
Understanding Basic Statistics 6th Edition by Charles Henry Brase,Corrinne Pellillo Brase
Why don’t you like this exercise?
Other Minimum 8 character and maximum 255 character
Character 255


