
Understanding Basic Statistics 6th Edition by Charles Henry Brase,Corrinne Pellillo Brase
Edition 6ISBN: 978-1111827021Understanding Basic Statistics 6th Edition by Charles Henry Brase,Corrinne Pellillo Brase
Edition 6ISBN: 978-1111827021 Exercise 18
Please provide the following information for Problems 11-22, part (a):
(i) What is the level of significance State the null and alternate hypotheses.
(ii) Check Requirements What sampling distribution will you use What assumptions are you making What is the value of the sample test statistic
(iii) Find (or estimate) the P -value. Sketch the sampling distribution and show the area corresponding to the P -value.
(iv) Based on your answers in parts (i) - (iii), will you reject or fail to reject the null hypothesis Are the data statistically significant at level a
(v) Interpret your conclusion in the context of the application.
Note: For degrees of freedom d.f. not in the Student's t table, use the closest d.f. that is smaller. In some situations, this choice of d.f. may increase the P -value a small amount, and therefore produce a slightly more "conservative" answer.
Answers may vary due to rounding.
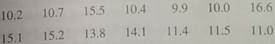
Agriculture: Bell Peppers The pathogen Phytophthora capsici causes bell peppers to wilt and die. Because bell peppers are an important commercial crop, this organism has undergone a great deal of agricultural research. It is thought that too much water aids the spread of the pathogen. Two field are under study. The first step in the research project is to compare the mean soil water content for the two fields (Source: Journal of Agricultural, Biological, and Environmental Statistics , Vol. 2, No. 2). Units are percentage of water by volume of soil.
Field A samples, x 1 :
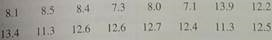
Field A samples, x 2 :
Use a calculator with mean and standard deviation keys to verify that
 , s 1 2.39,
 , and s 2 2.40.
(a) Assuming the distribution of soil water content in each field is mound-shaped and symmetrical, use a 5% level of significance to test the claim that field A has, on average, a higher soil water content than field B.
(b) Find a 90% confidence interval for 1 - 2. Explain the meaning of the confidence interval in the context of the problem.
(i) What is the level of significance State the null and alternate hypotheses.
(ii) Check Requirements What sampling distribution will you use What assumptions are you making What is the value of the sample test statistic
(iii) Find (or estimate) the P -value. Sketch the sampling distribution and show the area corresponding to the P -value.
(iv) Based on your answers in parts (i) - (iii), will you reject or fail to reject the null hypothesis Are the data statistically significant at level a
(v) Interpret your conclusion in the context of the application.
Note: For degrees of freedom d.f. not in the Student's t table, use the closest d.f. that is smaller. In some situations, this choice of d.f. may increase the P -value a small amount, and therefore produce a slightly more "conservative" answer.
Answers may vary due to rounding.
Agriculture: Bell Peppers The pathogen Phytophthora capsici causes bell peppers to wilt and die. Because bell peppers are an important commercial crop, this organism has undergone a great deal of agricultural research. It is thought that too much water aids the spread of the pathogen. Two field are under study. The first step in the research project is to compare the mean soil water content for the two fields (Source: Journal of Agricultural, Biological, and Environmental Statistics , Vol. 2, No. 2). Units are percentage of water by volume of soil.
Field A samples, x 1 :
Field A samples, x 2 :
Use a calculator with mean and standard deviation keys to verify that
, s 1 2.39, , and s 2 2.40.(a) Assuming the distribution of soil water content in each field is mound-shaped and symmetrical, use a 5% level of significance to test the claim that field A has, on average, a higher soil water content than field B.
(b) Find a 90% confidence interval for 1 - 2. Explain the meaning of the confidence interval in the context of the problem.
Explanation Verified
(a)
Let
![]() and
and
![]() be the means of the di...
be the means of the di...
Understanding Basic Statistics 6th Edition by Charles Henry Brase,Corrinne Pellillo Brase
Why don’t you like this exercise?
Other Minimum 8 character and maximum 255 character
Character 255


