
Understanding Basic Statistics 6th Edition by Charles Henry Brase,Corrinne Pellillo Brase
Edition 6ISBN: 978-1111827021Understanding Basic Statistics 6th Edition by Charles Henry Brase,Corrinne Pellillo Brase
Edition 6ISBN: 978-1111827021 Exercise 72
For each hypothesis test in Problems 3-10, please provide the following information:
(i) What is the level of significance State the null and alternate hypotheses.
(ii) Check Requirements What sampling distribution will you use What asumptions are you making What is the value of the sample test statistic
(iii) Find (or estimate) the P -value. Sketch the sampling distribution and show the area corresponding to the P -value.
(iv) Based on your answers in parts (i) - (iii), will you reject or fail to reject the null hypothesis Are the data statistically significant at level
(v) Interpret your conclusion in the context of the application.
Note: For degrees of freedom d.f. not in the Student's t table, use the closest d.f. that is smaller. In some cases, this choice will increase the P -value by a small amount or increase the length of a confidence interval, thereby making the answer slightly more "conservative." Answers may vary due to rounding.
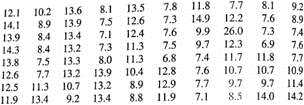
Agriculture: Bell Peppers The following data represent soil water content (percentage of water by volume) for independent random samples of soil taken from two experimental fields growing bell peppers (Reference: Journal of Agricultural, Biological, and Environmental Statistics ). Note: These data are also available for download at http://www.cengagebrain.com.
Soil water content from field I: x 1 ; n 1 = 72
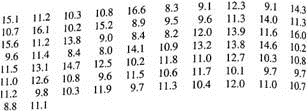
Soil water content from field II: x 2 ; n 2 = 80
(a) Use a calculator with mean and standard deviation keys to verify that
 , s 1 2.08,
 , and s 2 3.03.
(b) Let 1 be the population mean for x 1 and let 2 be the population mean for x 2. Find a 95% confidence interval for 1 2.
(c) Examine the confidence interval and explain what it means in the context of this problem. Does the interval consist of numbers that are all positive all negative of different signs At the 95% level of confidence, is the population mean soil water content of the first field higher than that of the second field
(d) Which distribution (standard normal or Student's t ) did you use Why Do you need information about the soil water content distributions
(e) Use = 0.01 to test the claim that the population mean soil water content of the first field is higher than that of the second.
(i) What is the level of significance State the null and alternate hypotheses.
(ii) Check Requirements What sampling distribution will you use What asumptions are you making What is the value of the sample test statistic
(iii) Find (or estimate) the P -value. Sketch the sampling distribution and show the area corresponding to the P -value.
(iv) Based on your answers in parts (i) - (iii), will you reject or fail to reject the null hypothesis Are the data statistically significant at level
(v) Interpret your conclusion in the context of the application.
Note: For degrees of freedom d.f. not in the Student's t table, use the closest d.f. that is smaller. In some cases, this choice will increase the P -value by a small amount or increase the length of a confidence interval, thereby making the answer slightly more "conservative." Answers may vary due to rounding.
Agriculture: Bell Peppers The following data represent soil water content (percentage of water by volume) for independent random samples of soil taken from two experimental fields growing bell peppers (Reference: Journal of Agricultural, Biological, and Environmental Statistics ). Note: These data are also available for download at http://www.cengagebrain.com.
Soil water content from field I: x 1 ; n 1 = 72
Soil water content from field II: x 2 ; n 2 = 80
(a) Use a calculator with mean and standard deviation keys to verify that
, s 1 2.08, , and s 2 3.03.(b) Let 1 be the population mean for x 1 and let 2 be the population mean for x 2. Find a 95% confidence interval for 1 2.
(c) Examine the confidence interval and explain what it means in the context of this problem. Does the interval consist of numbers that are all positive all negative of different signs At the 95% level of confidence, is the population mean soil water content of the first field higher than that of the second field
(d) Which distribution (standard normal or Student's t ) did you use Why Do you need information about the soil water content distributions
(e) Use = 0.01 to test the claim that the population mean soil water content of the first field is higher than that of the second.
Explanation Verified
(a)
From the data we verified that
![]()
![]() (...
(...
Understanding Basic Statistics 6th Edition by Charles Henry Brase,Corrinne Pellillo Brase
Why don’t you like this exercise?
Other Minimum 8 character and maximum 255 character
Character 255


