
Understanding Basic Statistics 6th Edition by Charles Henry Brase,Corrinne Pellillo Brase
Edition 6ISBN: 978-1111827021Understanding Basic Statistics 6th Edition by Charles Henry Brase,Corrinne Pellillo Brase
Edition 6ISBN: 978-1111827021 Exercise 54
For each hypothesis test in Problems 3-10, please provide the following information:
(i) What is the level of significance State the null and alternate hypotheses.
(ii) Check Requirements What sampling distribution will you use What asumptions are you making What is the value of the sample test statistic
(iii) Find (or estimate) the P -value. Sketch the sampling distribution and show the area corresponding to the P -value.
(iv) Based on your answers in parts (i) - (iii), will you reject or fail to reject the null hypothesis Are the data statistically significant at level
(v) Interpret your conclusion in the context of the application.
Note: For degrees of freedom d.f. not in the Student's t table, use the closest d.f. that is smaller. In some cases, this choice will increase the P -value by a small amount or increase the length of a confidence interval, thereby making the answer slightly more "conservative." Answers may vary due to rounding.
Marketing: Sporting Goods A marketing consultant was hired to visit a random sample of five sporting goods stores across the state of California. Each store was part of a large franchise of sporting goods stores. The consultant taught the managers of each store better ways to advertise and display their goods. The net sales for 1 month before and 1 month after the consultant's visit were recorded as follows for each store (in thousands of dollars):
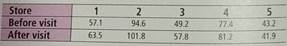
Do the data indicate that the average net sales improved (Use = 0.05.)
(i) What is the level of significance State the null and alternate hypotheses.
(ii) Check Requirements What sampling distribution will you use What asumptions are you making What is the value of the sample test statistic
(iii) Find (or estimate) the P -value. Sketch the sampling distribution and show the area corresponding to the P -value.
(iv) Based on your answers in parts (i) - (iii), will you reject or fail to reject the null hypothesis Are the data statistically significant at level
(v) Interpret your conclusion in the context of the application.
Note: For degrees of freedom d.f. not in the Student's t table, use the closest d.f. that is smaller. In some cases, this choice will increase the P -value by a small amount or increase the length of a confidence interval, thereby making the answer slightly more "conservative." Answers may vary due to rounding.
Marketing: Sporting Goods A marketing consultant was hired to visit a random sample of five sporting goods stores across the state of California. Each store was part of a large franchise of sporting goods stores. The consultant taught the managers of each store better ways to advertise and display their goods. The net sales for 1 month before and 1 month after the consultant's visit were recorded as follows for each store (in thousands of dollars):
Do the data indicate that the average net sales improved (Use = 0.05.)
Explanation Verified
(i)
![]()
![]() (ii)
(ii)
We use the sampling distribu...
Understanding Basic Statistics 6th Edition by Charles Henry Brase,Corrinne Pellillo Brase
Why don’t you like this exercise?
Other Minimum 8 character and maximum 255 character
Character 255


