
Understanding Basic Statistics 6th Edition by Charles Henry Brase,Corrinne Pellillo Brase
Edition 6ISBN: 978-1111827021Understanding Basic Statistics 6th Edition by Charles Henry Brase,Corrinne Pellillo Brase
Edition 6ISBN: 978-1111827021 Exercise 63
For each hypothesis test in Problems 3-10, please provide the following information:
(i) What is the level of significance State the null and alternate hypotheses.
(ii) Check Requirements What sampling distribution will you use What asumptions are you making What is the value of the sample test statistic
(iii) Find (or estimate) the P -value. Sketch the sampling distribution and show the area corresponding to the P -value.
(iv) Based on your answers in parts (i) - (iii), will you reject or fail to reject the null hypothesis Are the data statistically significant at level
(v) Interpret your conclusion in the context of the application.
Note: For degrees of freedom d.f. not in the Student's t table, use the closest d.f. that is smaller. In some cases, this choice will increase the P -value by a small amount or increase the length of a confidence interval, thereby making the answer slightly more "conservative." Answers may vary due to rounding.
Psychology: Creative Thinking Six sets of identical twins were randomly selected from a population of identical twins. One child was taken at random from each pair to form an experimental group. These children participated in a program designed to promote creative thinking. The other child from each pair was part of the control group that did not participate in the program to promote creative thinking. At the end of the program, a creative problem-solving test was given, with the results shown in the following table:
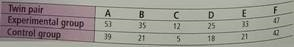
Higher scores indicate better performance in creative problem solving. Do the data support the claim that the program of the experimental group promoted creative problem solving (Use = 0.01.)
(i) What is the level of significance State the null and alternate hypotheses.
(ii) Check Requirements What sampling distribution will you use What asumptions are you making What is the value of the sample test statistic
(iii) Find (or estimate) the P -value. Sketch the sampling distribution and show the area corresponding to the P -value.
(iv) Based on your answers in parts (i) - (iii), will you reject or fail to reject the null hypothesis Are the data statistically significant at level
(v) Interpret your conclusion in the context of the application.
Note: For degrees of freedom d.f. not in the Student's t table, use the closest d.f. that is smaller. In some cases, this choice will increase the P -value by a small amount or increase the length of a confidence interval, thereby making the answer slightly more "conservative." Answers may vary due to rounding.
Psychology: Creative Thinking Six sets of identical twins were randomly selected from a population of identical twins. One child was taken at random from each pair to form an experimental group. These children participated in a program designed to promote creative thinking. The other child from each pair was part of the control group that did not participate in the program to promote creative thinking. At the end of the program, a creative problem-solving test was given, with the results shown in the following table:
Higher scores indicate better performance in creative problem solving. Do the data support the claim that the program of the experimental group promoted creative problem solving (Use = 0.01.)
Explanation Verified
(i)
We are given that
![]()
![]() (ii)
(ii)
We use th...
Understanding Basic Statistics 6th Edition by Charles Henry Brase,Corrinne Pellillo Brase
Why don’t you like this exercise?
Other Minimum 8 character and maximum 255 character
Character 255


