
Understanding Basic Statistics 6th Edition by Charles Henry Brase,Corrinne Pellillo Brase
Edition 6ISBN: 978-1111827021Understanding Basic Statistics 6th Edition by Charles Henry Brase,Corrinne Pellillo Brase
Edition 6ISBN: 978-1111827021 Exercise 27
For Problems 5-14, please provide the following information.
(a) What is the level of significance State the null and alternate hypotheses.
(b) Find the value of the chi-square statistic for the sample. Are all the expected frequencies greater than 5 What sampling distribution will you use What are the degrees of freedom
(c) Find or estimate the P -value of the sample test statistic.
(d) Based on your answers in parts (a)-(c), will you reject or fail to reject the null hypothesis that the population fits the specified distribution of categories
(e) Interpret your conclusion in the context of the application.
Meteorology: Normal Distribution The following problem is based on information from the National Oceanic and Atmospheric Administration (NOAA) Environmental Data Service. Let x be a random variable that represents the average daily temperature (in degrees Fahrenheit) in July in the town of Kit Carson, Colorado. The x distribution has a mean of approximately 75°F and standard deviation of approximately 8°F. A 20-year study (620 July days) gave the entries in the rightmost column of the following table.
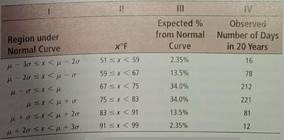
(i) Remember that = 75 and = 8. Examine Figure 7-3 in Chapter 7. Write a brief explanation for Columns I, II, and III in the context of this problem.
(ii) Use a 1% level of significance to test the claim that the average daily July temperature follows a normal distribution with = 75 and = 8.
(a) What is the level of significance State the null and alternate hypotheses.
(b) Find the value of the chi-square statistic for the sample. Are all the expected frequencies greater than 5 What sampling distribution will you use What are the degrees of freedom
(c) Find or estimate the P -value of the sample test statistic.
(d) Based on your answers in parts (a)-(c), will you reject or fail to reject the null hypothesis that the population fits the specified distribution of categories
(e) Interpret your conclusion in the context of the application.
Meteorology: Normal Distribution The following problem is based on information from the National Oceanic and Atmospheric Administration (NOAA) Environmental Data Service. Let x be a random variable that represents the average daily temperature (in degrees Fahrenheit) in July in the town of Kit Carson, Colorado. The x distribution has a mean of approximately 75°F and standard deviation of approximately 8°F. A 20-year study (620 July days) gave the entries in the rightmost column of the following table.
(i) Remember that = 75 and = 8. Examine Figure 7-3 in Chapter 7. Write a brief explanation for Columns I, II, and III in the context of this problem.
(ii) Use a 1% level of significance to test the claim that the average daily July temperature follows a normal distribution with = 75 and = 8.
Explanation Verified
(i)
We are given that
![]()
![]() From the graph...
From the graph...
Understanding Basic Statistics 6th Edition by Charles Henry Brase,Corrinne Pellillo Brase
Why don’t you like this exercise?
Other Minimum 8 character and maximum 255 character
Character 255


