
Understanding Basic Statistics 6th Edition by Charles Henry Brase,Corrinne Pellillo Brase
Edition 6ISBN: 978-1111827021Understanding Basic Statistics 6th Edition by Charles Henry Brase,Corrinne Pellillo Brase
Edition 6ISBN: 978-1111827021 Exercise 37
For Problems 5-14, please provide the following information.
(a) What is the level of significance State the null and alternate hypotheses.
(b) Find the value of the chi-square statistic for the sample. Are all the expected frequencies greater than 5 What sampling distribution will you use What are the degrees of freedom
(c) Find or estimate the P -value of the sample test statistic.
(d) Based on your answers in parts (a)-(c), will you reject or fail to reject the null hypothesis that the population fits the specified distribution of categories
(e) Interpret your conclusion in the context of the application.
Ecology: Fish The Fish and Game Department stocked Lake Lulu with fish in the following proportions: 30% catfish, 15% bass, 40% bluegill, and 15% pike. Five years later it sampled the lake to see if the distribution of fish had changed. It found that the 500 fish in the sample were distributed as follows:
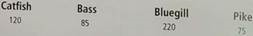
In the 5-year interval, did the distribution of fish change at the 0.05 level
(a) What is the level of significance State the null and alternate hypotheses.
(b) Find the value of the chi-square statistic for the sample. Are all the expected frequencies greater than 5 What sampling distribution will you use What are the degrees of freedom
(c) Find or estimate the P -value of the sample test statistic.
(d) Based on your answers in parts (a)-(c), will you reject or fail to reject the null hypothesis that the population fits the specified distribution of categories
(e) Interpret your conclusion in the context of the application.
Ecology: Fish The Fish and Game Department stocked Lake Lulu with fish in the following proportions: 30% catfish, 15% bass, 40% bluegill, and 15% pike. Five years later it sampled the lake to see if the distribution of fish had changed. It found that the 500 fish in the sample were distributed as follows:
In the 5-year interval, did the distribution of fish change at the 0.05 level
Explanation Verified
(a)
![]() The distributions are the same.
The distributions are the same.
...
Understanding Basic Statistics 6th Edition by Charles Henry Brase,Corrinne Pellillo Brase
Why don’t you like this exercise?
Other Minimum 8 character and maximum 255 character
Character 255


