
Understanding Basic Statistics 6th Edition by Charles Henry Brase,Corrinne Pellillo Brase
Edition 6ISBN: 978-1111827021Understanding Basic Statistics 6th Edition by Charles Henry Brase,Corrinne Pellillo Brase
Edition 6ISBN: 978-1111827021 Exercise 64
In Problems 7-12, parts (a) and (b) relate to testing . Part (c) requests the value of S c. Part (e) relates to confidence intervals for prediction. Part (f) relates to testing . Answers may very due to rounding.
Baseball: Batting Average and Strikeouts Let x be a random variable that represents the batting average of a professional baseball player. Let y be a random variable that represents the percentage of strikeouts of a professional baseball player. A random sample of n = 6 professional baseball players gave the following information (Reference: The Baseball Encyclopedia , Macmillan):
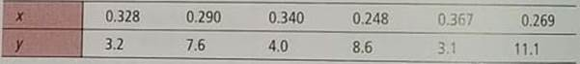
(a) Verify that x = 1.842, y = 37.6, x 2 = 0.575838, y 2 = 290.78, xy = 10.87, and r 0.891.
(b) Use a 5% level of significance to test the claim that 0.
(c) Verify that S e 1.6838, a 26.247, and b 65.081.
(d) Find the predicted percentage of strikeouts for a player with an x = 0.300 batting average.
(e) Find a 80% confidence interval for y when x = 0.300.
(f) Use a 5% level of significance to test the claim that 0.
Baseball: Batting Average and Strikeouts Let x be a random variable that represents the batting average of a professional baseball player. Let y be a random variable that represents the percentage of strikeouts of a professional baseball player. A random sample of n = 6 professional baseball players gave the following information (Reference: The Baseball Encyclopedia , Macmillan):
(a) Verify that x = 1.842, y = 37.6, x 2 = 0.575838, y 2 = 290.78, xy = 10.87, and r 0.891.
(b) Use a 5% level of significance to test the claim that 0.
(c) Verify that S e 1.6838, a 26.247, and b 65.081.
(d) Find the predicted percentage of strikeouts for a player with an x = 0.300 batting average.
(e) Find a 80% confidence interval for y when x = 0.300.
(f) Use a 5% level of significance to test the claim that 0.
Explanation Verified
(a)
From the data we verified that
![]() =1...
=1...
Understanding Basic Statistics 6th Edition by Charles Henry Brase,Corrinne Pellillo Brase
Why don’t you like this exercise?
Other Minimum 8 character and maximum 255 character
Character 255


