
Understanding Basic Statistics 6th Edition by Charles Henry Brase,Corrinne Pellillo Brase
Edition 6ISBN: 978-1111827021Understanding Basic Statistics 6th Edition by Charles Henry Brase,Corrinne Pellillo Brase
Edition 6ISBN: 978-1111827021 Exercise 74
In Problems 7-12, parts (a) and (b) relate to testing . Part (c) requests the value of S c. Part (e) relates to confidence intervals for prediction. Part (f) relates to testing . Answers may very due to rounding.
Scuba Diving: Depth What is the optimal time for a scuba diver to be on the bottom of the ocean That depends on the depth of the dive. The U.S. navy has done a lot of research on this topic. The Navy defines the "optimal time" to be the time at each depth for the best balance between length of work period and decompression time after surfacing. Let x = depth of dive in meters, and let y = optimal time in hours. A random sample of divers gave the following data (based on information taken from Textbook of Medical Physiology by A. C. Guyton, M.D):
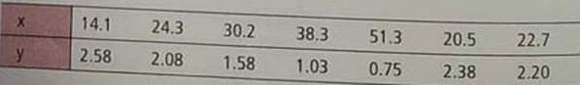
(a) Verify that x = 201.4, y = 12.6, x 2 = 6735.46, y 2 = 25.607, xy = 311.292, and r 0.976.
(b) Use a 1% level of significance to test the claim that 0.
(c) Verify that S e 0.1660, a 3.366, and b 0.0544.
(d) Find the predicted optimal time in hours for a dive depth of x = 18 meters.
(e) Find an 80% confidence interval for y when x = 18 meters.
(f) Use a 1% level of significance to test the claim that 0.
Scuba Diving: Depth What is the optimal time for a scuba diver to be on the bottom of the ocean That depends on the depth of the dive. The U.S. navy has done a lot of research on this topic. The Navy defines the "optimal time" to be the time at each depth for the best balance between length of work period and decompression time after surfacing. Let x = depth of dive in meters, and let y = optimal time in hours. A random sample of divers gave the following data (based on information taken from Textbook of Medical Physiology by A. C. Guyton, M.D):
(a) Verify that x = 201.4, y = 12.6, x 2 = 6735.46, y 2 = 25.607, xy = 311.292, and r 0.976.
(b) Use a 1% level of significance to test the claim that 0.
(c) Verify that S e 0.1660, a 3.366, and b 0.0544.
(d) Find the predicted optimal time in hours for a dive depth of x = 18 meters.
(e) Find an 80% confidence interval for y when x = 18 meters.
(f) Use a 1% level of significance to test the claim that 0.
Explanation Verified
(a)
From the data we verified that
![]() =2...
=2...
Understanding Basic Statistics 6th Edition by Charles Henry Brase,Corrinne Pellillo Brase
Why don’t you like this exercise?
Other Minimum 8 character and maximum 255 character
Character 255


