
Understanding Basic Statistics 6th Edition by Charles Henry Brase,Corrinne Pellillo Brase
Edition 6ISBN: 978-1111827021Understanding Basic Statistics 6th Edition by Charles Henry Brase,Corrinne Pellillo Brase
Edition 6ISBN: 978-1111827021 Exercise 10
Baseball: Batting Average and Home Runs In baseball, is there a linear correlation between batting average and home run percentage Let x represent the batting average of a professional baseball player, and let y represent the player's home run percentage (number of home runs per 100 times at bat). A random sample of n = 7 professional baseball players gave the following information (Reference: The Baseball Encyclopedia , Macmillan Publishing Company).
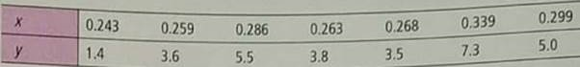
x = 1.957; x 2 = 0.553; y 2 30.1; y 2 = 150.15; xy 8.753
(a) Verify that S e 0.647.
(b) Verify that r 0.984. Test that is positive. Use = 0.01.
(c) Verify that b 55.166. Test that is positive. Use = 0.01.
(d) Verify that
 . Find a 90% confidence interval for the predicted home run percentage for a player with a batting average of 0.0310.
x = 1.957; x 2 = 0.553; y 2 30.1; y 2 = 150.15; xy 8.753
(a) Verify that S e 0.647.
(b) Verify that r 0.984. Test that is positive. Use = 0.01.
(c) Verify that b 55.166. Test that is positive. Use = 0.01.
(d) Verify that
. Find a 90% confidence interval for the predicted home run percentage for a player with a batting average of 0.0310.Explanation Verified
(a)
We are given that
![]() =1.957,
=1.957,
![]() =30....
=30....
Understanding Basic Statistics 6th Edition by Charles Henry Brase,Corrinne Pellillo Brase
Why don’t you like this exercise?
Other Minimum 8 character and maximum 255 character
Character 255


