
Understanding Basic Statistics 6th Edition by Charles Henry Brase,Corrinne Pellillo Brase
Edition 6ISBN: 978-1111827021Understanding Basic Statistics 6th Edition by Charles Henry Brase,Corrinne Pellillo Brase
Edition 6ISBN: 978-1111827021 Exercise 35
Expand Your Knowledge: Time Series and Serial Correlation Serial Correlation , also known as autocorrelation , describes the extent to which the result in one period of a time series is related to the result in the text period. A time series with high serial correlation is said to be very predictable from one period to the next. If the serial correlation is low (or near zero), the time series is considered to be much less predictable. For more information about serial correlation, see the book Ibbotson SBBI published by Morningstar.
A research veterinarian at a major university has developed a new vaccine to protect horses from West Nile virus. An important question is: How predictable is the buildup of antibodies in the horse's blood after the vaccination is given A large random sample of horses from Wyoming were given the vaccination. The average antibody buildup factor (as determined from blood samples) was measured each week after the vaccination for eight weeks. Results are shown in the following time series:
Original Time Series
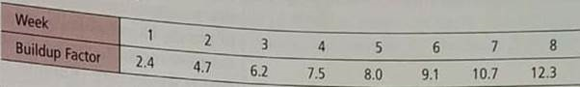
To construct a serial correlation, we simply use data pairs ( x , y ) where x = original buildup factor data and y = original data shifted ahead by one week. This gives us the following data set. Since we are shifting one week ahead, we now have 7 data pairs (not 8).
Data for Serial Correlation
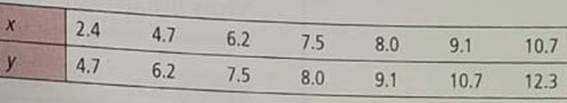
For convenience, we are given the following sums:
x = 48.6 y = 58.5 x 2 = 383.84 y 2 = 529.37 xy = 448.7
(a) Use the sums provided (or a calculator with least-squares regression) to compute the equation of the sample least squares line,
 . If the buildup factor was x = 5.8 one week, what would you predict the buildup factor to be the next week
(b) Compute the sample correlation coefficient r and the coefficient of determination r 2. Test p 0 at the 1% level of significance. Would you say the time series of antibody buildup factor is relatively predictable from one week to the next Explain.
A research veterinarian at a major university has developed a new vaccine to protect horses from West Nile virus. An important question is: How predictable is the buildup of antibodies in the horse's blood after the vaccination is given A large random sample of horses from Wyoming were given the vaccination. The average antibody buildup factor (as determined from blood samples) was measured each week after the vaccination for eight weeks. Results are shown in the following time series:
Original Time Series
To construct a serial correlation, we simply use data pairs ( x , y ) where x = original buildup factor data and y = original data shifted ahead by one week. This gives us the following data set. Since we are shifting one week ahead, we now have 7 data pairs (not 8).
Data for Serial Correlation
For convenience, we are given the following sums:
x = 48.6 y = 58.5 x 2 = 383.84 y 2 = 529.37 xy = 448.7
(a) Use the sums provided (or a calculator with least-squares regression) to compute the equation of the sample least squares line,
. If the buildup factor was x = 5.8 one week, what would you predict the buildup factor to be the next week(b) Compute the sample correlation coefficient r and the coefficient of determination r 2. Test p 0 at the 1% level of significance. Would you say the time series of antibody buildup factor is relatively predictable from one week to the next Explain.
Explanation Verified
We will study serial correlation using d...
Understanding Basic Statistics 6th Edition by Charles Henry Brase,Corrinne Pellillo Brase
Why don’t you like this exercise?
Other Minimum 8 character and maximum 255 character
Character 255


