
Understanding Basic Statistics 6th Edition by Charles Henry Brase,Corrinne Pellillo Brase
Edition 6ISBN: 978-1111827021Understanding Basic Statistics 6th Edition by Charles Henry Brase,Corrinne Pellillo Brase
Edition 6ISBN: 978-1111827021 Exercise 40
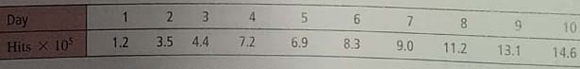
Expand Your Knowledge: Time Series and Serial Correlation An Internet advertising agency is studying the number of "hits" on a certain website during an advertising compaign. It is hoped that as the compaign progresses, the number of hits on the website will also increase in a predictable way from one day to the next. For 10 days of the compaign, the number of hits × 10 5 is shown:
Original Time Series
(a) To construct a serial correlation, we use data pairs ( x , y ) where x = original data and y = original data shifted ahead by one time period. Verify that the data set ( x , y ) for serial correlation is shown here. (For discussion of serial correlation, see Problem15.)
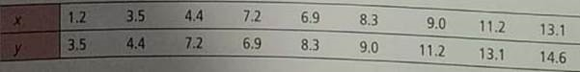
(b) For the ( x , y ) data set of part (a), compute the equation of the sample least-squares line
 . If the number of hits was 9.3 (×10 5 ) one day, what do you predict for the number of hits the next day
(c) Compute the sample correlation coefficient r and the coefficient of determination r 2. Test 0 at the 1% level of significance. Would you say the time series of website hits is relatively predictable from one day to the next Explain.
Original Time Series
(a) To construct a serial correlation, we use data pairs ( x , y ) where x = original data and y = original data shifted ahead by one time period. Verify that the data set ( x , y ) for serial correlation is shown here. (For discussion of serial correlation, see Problem15.)
(b) For the ( x , y ) data set of part (a), compute the equation of the sample least-squares line
. If the number of hits was 9.3 (×10 5 ) one day, what do you predict for the number of hits the next day(c) Compute the sample correlation coefficient r and the coefficient of determination r 2. Test 0 at the 1% level of significance. Would you say the time series of website hits is relatively predictable from one day to the next Explain.
Explanation Verified
We will study serial correlation using d...
Understanding Basic Statistics 6th Edition by Charles Henry Brase,Corrinne Pellillo Brase
Why don’t you like this exercise?
Other Minimum 8 character and maximum 255 character
Character 255


