
Understanding Basic Statistics 6th Edition by Charles Henry Brase,Corrinne Pellillo Brase
Edition 6ISBN: 978-1111827021Understanding Basic Statistics 6th Edition by Charles Henry Brase,Corrinne Pellillo Brase
Edition 6ISBN: 978-1111827021 Exercise 45
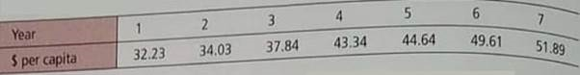
Expand Your Knowledge: Time Series and Serial Correlation A company that produces and markets video games wants to estimate the predictability of per capita consumer spending on video games in the United States. For the most recent seven years, the amount of annual spending per person per year in shown here (Reference: Statistical Abstract of the United States , 128 th edition):
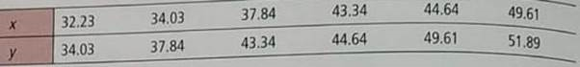
(a) To construct a serial correlation, we use data pairs ( x , y ) where x = original data and y = original data shifted ahead by one time period. Verify that the data set ( x , y ) for serial correlation is shown here. (For discussion of serial correlation, see Problem 15.)
(b) For the ( x , y ) data set of part (a), compute the equation of the sample least-squares line
 . If the per capita spending was x = $42 one year, what do you predict for the spending the next year
(c) Compute the sample correlation coefficient r and the coefficient of determination r 2. Test 0 at the 1% level of significance. Would you say the time series of per capita spending on video games is relatively predictable from one year to the next Explain.
(a) To construct a serial correlation, we use data pairs ( x , y ) where x = original data and y = original data shifted ahead by one time period. Verify that the data set ( x , y ) for serial correlation is shown here. (For discussion of serial correlation, see Problem 15.)
(b) For the ( x , y ) data set of part (a), compute the equation of the sample least-squares line
. If the per capita spending was x = $42 one year, what do you predict for the spending the next year(c) Compute the sample correlation coefficient r and the coefficient of determination r 2. Test 0 at the 1% level of significance. Would you say the time series of per capita spending on video games is relatively predictable from one year to the next Explain.
Explanation Verified
We will study serial correlation using d...
Understanding Basic Statistics 6th Edition by Charles Henry Brase,Corrinne Pellillo Brase
Why don’t you like this exercise?
Other Minimum 8 character and maximum 255 character
Character 255


