
Microeconomics 19th Edition by Campbell McConnell,Stanley Brue,Sean Flynn
Edition 19ISBN: 978-0070998544Microeconomics 19th Edition by Campbell McConnell,Stanley Brue,Sean Flynn
Edition 19ISBN: 978-0070998544 Exercise 2
Indicate how each of the following might affect the data shown in the table and graph in Figure 2 of tliis appendix: LO7
a. GSU's athletic director schedules higher-quality opponents.
b. An NBA team locates in die city where GSU plays.
c. GSU contracts to have all its home games televised.
a. GSU's athletic director schedules higher-quality opponents.
b. An NBA team locates in die city where GSU plays.
c. GSU contracts to have all its home games televised.
Explanation Verified
Ticket prices determine attendance at GSU basketball games. Here the independent and dependent variables are ticket price and the quantity of tickets purchased respectively.
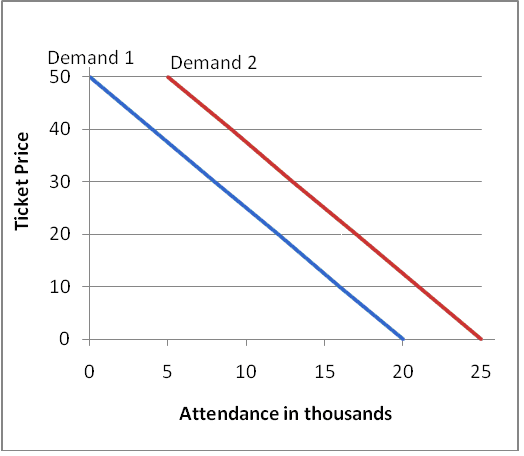
(a) In the given sequence, there would be an increase in the demand making them to buy tickets at each given price. Therefore, there would be a shift in the demand curve to its right.
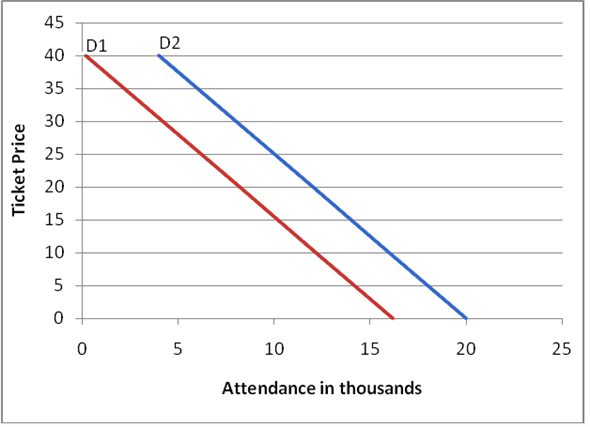
 (b) In this situation, fewer tickets will be bought and the attendance becomes less at each price, this shifts the demand curve to its left. This is shown in the graph below:
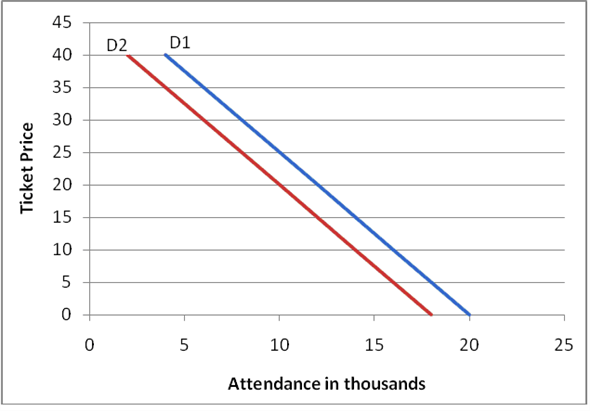
 (c) In the given case, fewer tickets are bought at each price. This shifts demand curve to its left. This is indicated in the graph below:
(a) In the given sequence, there would be an increase in the demand making them to buy tickets at each given price. Therefore, there would be a shift in the demand curve to its right.
(b) In this situation, fewer tickets will be bought and the attendance becomes less at each price, this shifts the demand curve to its left. This is shown in the graph below: (c) In the given case, fewer tickets are bought at each price. This shifts demand curve to its left. This is indicated in the graph below:Microeconomics 19th Edition by Campbell McConnell,Stanley Brue,Sean Flynn
Why don’t you like this exercise?
Other Minimum 8 character and maximum 255 character
Character 255


