Microeconomics 19th Edition by Campbell McConnell,Stanley Brue,Sean Flynn
Edition 19ISBN: 978-0070998544Microeconomics 19th Edition by Campbell McConnell,Stanley Brue,Sean Flynn
Edition 19ISBN: 978-0070998544 Exercise 4
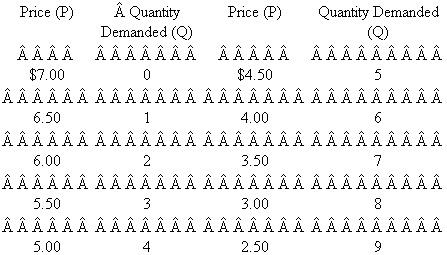
Use the demand schedule at the top of the next page to calculate total revenue and marginal revenue at each quantity. Plot the demand, total-revenue, and marginal-revenue curves, and explain the relationships between them. Explain why the marginal revenue of the fourth unit of output is $3.50, even though its price is $5. Use Chapter 4's total- revenue test for price elasticity to designate the elastic and inelastic segments of your graphed demand curve. What generalization can you make as to the relationship between marginal revenue and elasticity of demand? Suppose the marginal cost of successive units of output was zero. What output would the profit-seeking firm produce? Finally, use your analysis to explain why a monopolist would never produce in the inelastic region of demand.
Explanation Verified
![]() x-axis represents the price and y-axis ...
x-axis represents the price and y-axis ...
Microeconomics 19th Edition by Campbell McConnell,Stanley Brue,Sean Flynn
Why don’t you like this exercise?
Other Minimum 8 character and maximum 255 character
Character 255


