An Introduction to Community & Public Health 8th Edition by James McKenzie, Pinger
Edition 8ISBN: 9781284036596An Introduction to Community & Public Health 8th Edition by James McKenzie, Pinger
Edition 8ISBN: 9781284036596 Exercise 15
Look at the data in Table 1. What conclusion can you draw about the risk for acquiring tuberculosis for populations in each age group? Write down your answer. Now examine Table 2. Which age groups exhibit the highest disease rates? Explain why it is important to calculate rates to report disease outbreaks accurately.
TABLE 1 Reported Tuberculosis Cases, by Age group, Low Socloeconomic Area, City of Dixon, 1960
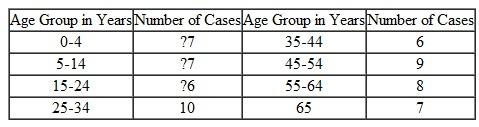 Source: Centers for Disease Control and Prevention.
TABLE 2 Reported Tuberculosis Cases and incidence rates per 100,000, Low Socioeconomic Area, City of Dixon, 1960
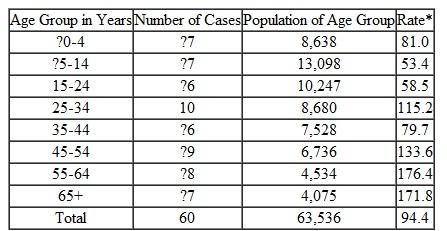 *Example: 7 cases ÷ 8,638 population × 100,000 = 81.0.
Source: Centers for Disease Control and Prevention.
TABLE 1 Reported Tuberculosis Cases, by Age group, Low Socloeconomic Area, City of Dixon, 1960
Source: Centers for Disease Control and Prevention.TABLE 2 Reported Tuberculosis Cases and incidence rates per 100,000, Low Socioeconomic Area, City of Dixon, 1960
*Example: 7 cases ÷ 8,638 population × 100,000 = 81.0.Source: Centers for Disease Control and Prevention.
Explanation Verified
Community health concerns about the over...
An Introduction to Community & Public Health 8th Edition by James McKenzie, Pinger
Why don’t you like this exercise?
Other Minimum 8 character and maximum 255 character
Character 255


