
Holt Modern Biology 1st Edition by John Postlethwait ,Janet Hopson
Edition 1ISBN: 9780030651786Holt Modern Biology 1st Edition by John Postlethwait ,Janet Hopson
Edition 1ISBN: 9780030651786 Exercise 17
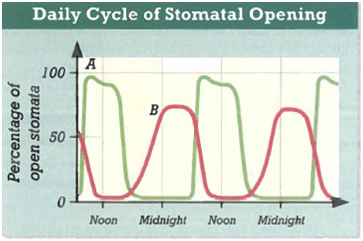
Interpreting Graphics The graph below shows how the percentage of stomata that are open varies over time for two different plants. One curve represents the stomata of a geranium, and the other curve represents the stomata of a pineapple. Which curve corresponds to the pineapple stomata? Explain your reasoning.
Explanation Verified
CAM (Crassulacean acid metabolism) is a ...
Holt Modern Biology 1st Edition by John Postlethwait ,Janet Hopson
Why don’t you like this exercise?
Other Minimum 8 character and maximum 255 character
Character 255


