
Holt Modern Biology 1st Edition by John Postlethwait ,Janet Hopson
Edition 1ISBN: 9780030651786Holt Modern Biology 1st Edition by John Postlethwait ,Janet Hopson
Edition 1ISBN: 9780030651786 Exercise 20
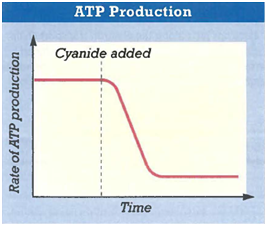
Interpreting Graphics The graph below shows the rate of ATP production by a culture of yeast cells over time. At the time indicated by the dashed line, cyanide was added to the culture. Cyanide blocks the flow of electrons to O2 from the electron transport chain in mitochondria. Explain why adding cyanide affects ATP production in the way indicated by the graph.
Explanation Verified
The sequence of reactions whereby the re...
Holt Modern Biology 1st Edition by John Postlethwait ,Janet Hopson
Why don’t you like this exercise?
Other Minimum 8 character and maximum 255 character
Character 255


