
Holt Modern Biology 1st Edition by John Postlethwait ,Janet Hopson
Edition 1ISBN: 9780030651786Holt Modern Biology 1st Edition by John Postlethwait ,Janet Hopson
Edition 1ISBN: 9780030651786 Exercise 37
INTERPRETING GRAPHICS: The graph below shows the number of cigarettes smoked per capita per year between 1920 and 2000 and the annual incidence of lung cancer among women. Use the graph to answer the question that follows.
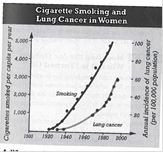
What was the relationship between number of cigarettes smoked and incidence of lung cancer?
F) There was no relationship between cigarette smoking and lung cancer.
G) As the number of cigarettes smoked decreased, the incidence of lung cancer increased.
H) As the number of cigarettes smoked increased, the incidence of lung cancer increased.
J) As the number of cigarettes smoked increased, the incidence of lung cancer decreased.
Explanation Verified
It can be seen from the graph that there...
Holt Modern Biology 1st Edition by John Postlethwait ,Janet Hopson
Why don’t you like this exercise?
Other Minimum 8 character and maximum 255 character
Character 255


