Holt Modern Biology 1st Edition by John Postlethwait ,Janet Hopson
Edition 1ISBN: 9780030651786Holt Modern Biology 1st Edition by John Postlethwait ,Janet Hopson
Edition 1ISBN: 9780030651786 Exercise 10
INTERPRETING GRAPHICS: The graph below shows the variation in average beak size in a group of finches in the Galapagos Islands over time. These finches eat mostly seeds. Use the graph to answer the question that follows.
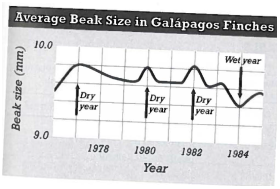
Beak size in these finches is correlated to the size of seeds they can eat. What can be inferred from the graph?
F) In wet years, the finches that survive are mostly those that can eat larger seeds.
G) In dry years, the finches that survive are mostly those that can eat larger seeds.
H) In all years, the finches that survive are mostly those that can eat larger seeds.
J) In all years, the finches that survive are mostly those that can eat smaller seeds.
Explanation Verified
Natural selection is known as a process,...
Holt Modern Biology 1st Edition by John Postlethwait ,Janet Hopson
Why don’t you like this exercise?
Other Minimum 8 character and maximum 255 character
Character 255


