
Holt Modern Biology 1st Edition by John Postlethwait ,Janet Hopson
Edition 1ISBN: 9780030651786Holt Modern Biology 1st Edition by John Postlethwait ,Janet Hopson
Edition 1ISBN: 9780030651786 Exercise 29
INTERPRETING GRAPHICS: The graph below shows the size of a particular population over time. Use the graph to answer the question that follows.
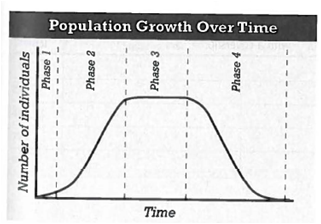
In the graph, which time period shows negative growth of the population?
A) phase 1
B) phase 2
C) phase 3
D) phase 4
In the graph, which time period shows negative growth of the population?
A) phase 1
B) phase 2
C) phase 3
D) phase 4
Explanation Verified
Growth a population is affected by sever...
Holt Modern Biology 1st Edition by John Postlethwait ,Janet Hopson
Why don’t you like this exercise?
Other Minimum 8 character and maximum 255 character
Character 255


