
Economics of Social Issues 20th Edition by Ansel Sharp, Charles Register , Paul Grimes
Edition 20ISBN: 978-0073523248Economics of Social Issues 20th Edition by Ansel Sharp, Charles Register , Paul Grimes
Edition 20ISBN: 978-0073523248 Exercise 1
Suppose an economy produces only food and housing. Draw and explain the characteristics of its production possibilities curve. Show and explain the impact on the curve of ( a ) a new technology that improves food production only; ( b ) a new invention that improves both food and housing production.
Explanation Verified
The production possibilities curve for an economy that can produce food and housing would have the following shape.
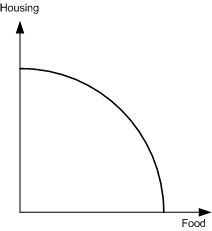 The curve shows combined production rates of housing and food that represent efficient economic production, in which the total productivity is maximized. Points above the curve cannot be achieved by the economy in its current state while points under the curve represent inefficient production.
The curve illustrates that there is a tradeoff between food and housing for efficient production. That is, an increase in food production necessitates a decrease in housing production, and vice versa. This is the opportunity cost associated with a change in production. The convex shape of the curve characterizes the opportunity cost further, in that the costs increase as the base production values increase in either food or housing. That is, it is less costly to increase food production if the original value is low, and more costly to increase food production with its production is already high.
An improvement in productivity due to new technologies would increase the capability of the economy for producing food, but would not add the ability to produce housing. The movement of the curve is illustrated as follows.
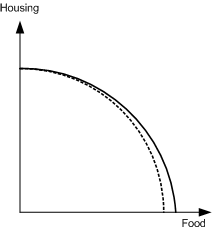 In this case, there is still a tradeoff between housing and food, and the amounts of housing for each point have not changed. However, the rate of food production has increased for every point along the curve except at zero food production.
An improvement in productivity due to a breakthrough affecting both food and housing production would move the curve as illustrated in the following drawing.
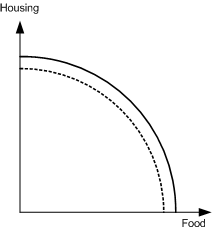 With this type of improvement, the tradeoffs between housing and food still exist, but the overall range of efficient production represented by points along the production possibilities curve have moved outward in both axes relative to the original curve. Thus, the overall capability of the economy has increased in both of its dimensions. The opportunity cost relationship between food and housing still exists, but it is now possible to achieve combined rates of production that were previously unattainable.
The curve shows combined production rates of housing and food that represent efficient economic production, in which the total productivity is maximized. Points above the curve cannot be achieved by the economy in its current state while points under the curve represent inefficient production.The curve illustrates that there is a tradeoff between food and housing for efficient production. That is, an increase in food production necessitates a decrease in housing production, and vice versa. This is the opportunity cost associated with a change in production. The convex shape of the curve characterizes the opportunity cost further, in that the costs increase as the base production values increase in either food or housing. That is, it is less costly to increase food production if the original value is low, and more costly to increase food production with its production is already high.
An improvement in productivity due to new technologies would increase the capability of the economy for producing food, but would not add the ability to produce housing. The movement of the curve is illustrated as follows.
In this case, there is still a tradeoff between housing and food, and the amounts of housing for each point have not changed. However, the rate of food production has increased for every point along the curve except at zero food production.An improvement in productivity due to a breakthrough affecting both food and housing production would move the curve as illustrated in the following drawing.
With this type of improvement, the tradeoffs between housing and food still exist, but the overall range of efficient production represented by points along the production possibilities curve have moved outward in both axes relative to the original curve. Thus, the overall capability of the economy has increased in both of its dimensions. The opportunity cost relationship between food and housing still exists, but it is now possible to achieve combined rates of production that were previously unattainable.Economics of Social Issues 20th Edition by Ansel Sharp, Charles Register , Paul Grimes
Why don’t you like this exercise?
Other Minimum 8 character and maximum 255 character
Character 255


