Economics of Social Issues 20th Edition by Ansel Sharp, Charles Register , Paul Grimes
Edition 20ISBN: 978-0073523248Economics of Social Issues 20th Edition by Ansel Sharp, Charles Register , Paul Grimes
Edition 20ISBN: 978-0073523248 Exercise 2
Using the concepts of marginal social benefit and marginal social cost, explain how the optimal combination of goods can be determined in an economy that produces only two goods.
Explanation Verified
The marginal social benefit (MSB) is the amount of increase in the production of a good that is achieved by a one-unit shift of the economy toward production, or a movement along the production possibilities curve. The cost associated with this one-unit shift in production is the marginal social cost (MSC). A criteria for deciding whether to accept a production is that the MSB should exceed the MSC, or MSB MSC.
The following production possibilities curve depicts a production shift where MSB MSC:
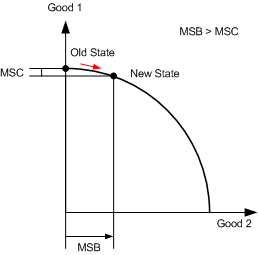 The MSB is clearly much larger than the MSC associated with the production shift. Because MSB MSC, this is a production shift that yields a net benefit to society.
The following production possibilities curve depicts a production shift where MSB MSC.
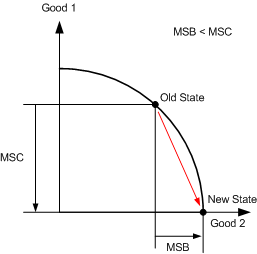 In contrast to the previous example, this production shift requires a much larger MSC than the MSB to be attained by the shift. Because MSB MSC, this production shift does not yield a net benefit to society.
Optimal production is represented by the point along the production possibilities curve where there is no production shift for which MSB MSC. In other words, any shift away from optimal production does not yield a net benefit. The following production possibilities curve shows optimal production and two potential one-unit production shifts toward good 1 or good 2.
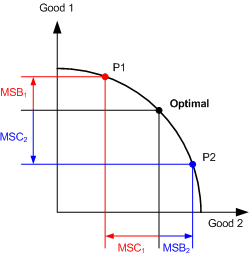 Points P1 and P2 represent the new points along the curve after potential production shifts respectively increasing production of good 1 or good 2. MSB 1 and MSB 2 are the respective MSBs associated with transitions to P1 and P2, while MSC 1 and MSC 2 are the respective MSCs. Note that MSB 1 MSC 1 and MSB 2 MSC 2. This is because the current production state is optimal; any shift away from the optimal point results in a situation where MSB MSC.
The optimal point can be located by starting at any point along the production possibilities curve and considering shifts toward either good 1 or good 2. If MSB MSC for a shift, the current point is not optimal and the shift should be made. When a point is reached at which MSB MSC for transitions in either direction, the production is optimal.
The following production possibilities curve depicts a production shift where MSB MSC:
The MSB is clearly much larger than the MSC associated with the production shift. Because MSB MSC, this is a production shift that yields a net benefit to society.The following production possibilities curve depicts a production shift where MSB MSC.
In contrast to the previous example, this production shift requires a much larger MSC than the MSB to be attained by the shift. Because MSB MSC, this production shift does not yield a net benefit to society.Optimal production is represented by the point along the production possibilities curve where there is no production shift for which MSB MSC. In other words, any shift away from optimal production does not yield a net benefit. The following production possibilities curve shows optimal production and two potential one-unit production shifts toward good 1 or good 2.
Points P1 and P2 represent the new points along the curve after potential production shifts respectively increasing production of good 1 or good 2. MSB 1 and MSB 2 are the respective MSBs associated with transitions to P1 and P2, while MSC 1 and MSC 2 are the respective MSCs. Note that MSB 1 MSC 1 and MSB 2 MSC 2. This is because the current production state is optimal; any shift away from the optimal point results in a situation where MSB MSC.The optimal point can be located by starting at any point along the production possibilities curve and considering shifts toward either good 1 or good 2. If MSB MSC for a shift, the current point is not optimal and the shift should be made. When a point is reached at which MSB MSC for transitions in either direction, the production is optimal.
Economics of Social Issues 20th Edition by Ansel Sharp, Charles Register , Paul Grimes
Why don’t you like this exercise?
Other Minimum 8 character and maximum 255 character
Character 255


