
Epidemiology for Public Health Practice 5th Edition by Robert Friis,Thomas Sellers
Edition 5ISBN: 978-1449665494Epidemiology for Public Health Practice 5th Edition by Robert Friis,Thomas Sellers
Edition 5ISBN: 978-1449665494 Exercise 12
Figure 2 is a chart that presents data on the incidence of pertussis (whooping cough) for 1975 through 2005.
a. What are the labels of the x and y axes?
b. Describe the overall trends reflected in the chart.
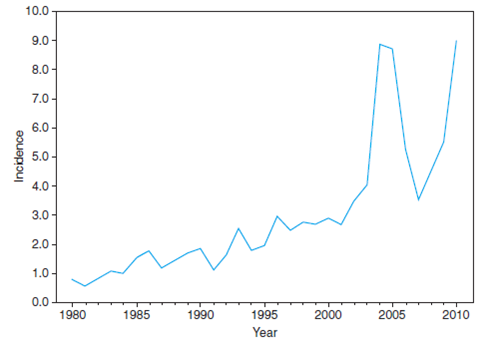
Pertussis continues to have cyclic peaks every 3 to 5 years.
Incidence in 2010 surpassed the previous peaks in 2004 and 2005.
Figure 2 Pertussis. Incidence* by year-United States, 1980-2010.
Source: Reproduced from Centers for Disease Control and Prevention, Summary of notifiable diseases-United States, 2010. MMWR. Vol 59, No 53, p. 75, 2012. *Per 100,000 population
a. What are the labels of the x and y axes?
b. Describe the overall trends reflected in the chart.
Pertussis continues to have cyclic peaks every 3 to 5 years.
Incidence in 2010 surpassed the previous peaks in 2004 and 2005.
Figure 2 Pertussis. Incidence* by year-United States, 1980-2010.
Source: Reproduced from Centers for Disease Control and Prevention, Summary of notifiable diseases-United States, 2010. MMWR. Vol 59, No 53, p. 75, 2012. *Per 100,000 population
Explanation Verified
The horizontal axis is named the x-axis,...
Epidemiology for Public Health Practice 5th Edition by Robert Friis,Thomas Sellers
Why don’t you like this exercise?
Other Minimum 8 character and maximum 255 character
Character 255


