Accounting 26th Edition by Carl Warren ,Jim Reeve ,Jonathan Duchac
Edition 26ISBN: 978-1337498159Accounting 26th Edition by Carl Warren ,Jim Reeve ,Jonathan Duchac
Edition 26ISBN: 978-1337498159 Exercise 28
Financial Statement Analysis
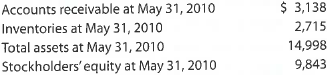
The financial statements for Nike, Inc., are presented in Appendix C at the end of the text. The following additional information (in thousands) is available:
Instructions
1. Determine the following measures for the fiscal years ended May 31, 2013 (fiscal 2012), and May 31, 2012 (fiscal 2011), rounding to one decimal place.
a. Working capital
b. Current ratio
c. Quick ratio
d. Accounts receivable turnover
e. Number of days' sales in receivables
f. Inventory turnover
g. Number of days' sales in inventory
h. Ratio of liabilities to stockholders' equity
i. Ratio of sales to assets
j. Rate earned on total assets, assuming interest expense is $23 million for the year ending May 31, 2013, and $31 million for the year ending May 31, 2012
k. Rate earned on common stockholders' equity
l. Price-earnings ratio, assuming that the market price was $61.66 per share on May 31, 2013, and $53.10 per share on May 31, 2012
m. Percentage relationship of net income to sales
2. What conclusions can be drawn from these analyses
Explanation Verified
1a)Working capital :
Working capital is...
Accounting 26th Edition by Carl Warren ,Jim Reeve ,Jonathan Duchac
Why don’t you like this exercise?
Other Minimum 8 character and maximum 255 character
Character 255


