Basic Engineering Circuit Analysis 11th Edition by David Irwin ,Robert Nelms
Edition 11ISBN: 978-1118539293Basic Engineering Circuit Analysis 11th Edition by David Irwin ,Robert Nelms
Edition 11ISBN: 978-1118539293 Exercise 2
The energy absorbed by the BOX in Fig. P1.19 is shown in the graph below. Calculate and sketch the current flowing into the BOX between 0 and 10 milliseconds.
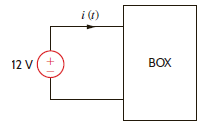
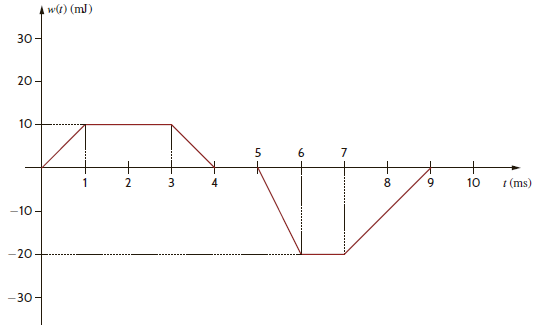
Figure P1.19
Figure P1.19
Explanation Verified
Consider the graph given in Figure P1.19 in the textbook.
For the considered graph, the slope of the curve between the energy
 and time
 can be calculated as follows:
 The power
 absorbed can be calculate by using equation 1.3 in the text book having voltage
 and current
 as follows:

 …… (1)
Calculate the slope of the line in between the time period of
 as follows:
 From equation (1) the value of current
 is given as follows:
 Therefore, for time period of
 the current flowing into the BOX is
 .
.
Calculate the slope of the line in between the time period of
 as follows:
 From equation (1) the value of current
 is given as follows:
 Therefore, for time period of
 the current flowing into the BOX is
 .
.
Calculate the slope of the line in between the time period of
 as follows:
 From equation (1) the value of current
 is given as follows:
 Therefore, for time period of
 the current flowing into the BOX is
 .
.
Calculate the slope of the line in between the time period of
 as follows:
 From equation (1) the value of current
 is given as follows:
 Therefore, for time period of
 the current flowing into the BOX is
 .
.
Calculate the slope of the line in between the time period of
 as follows:
 From equation (1) the value of current
 is given as follows:
 Therefore, for time period of
 the current flowing into the BOX is
 .
.
Calculate the slope of the line in between the time period of
 as follows:
 From equation (1) the value of current
 is given as follows:
 Therefore, for time period of
 the current flowing into the BOX is
 .
.
Calculate the slope of the line in between the time period of
 as follows:
 From equation (1) the value of current
 is given as follows:
 Therefore, for time period of
 the current flowing into the BOX is
 .
.
Calculate the slope of the line in between the time period of
 as follows:
 From equation (1) the value of current
 is given as follows:
 Therefore, for time period of
 the current flowing into the BOX is
 .
.
The figure 1 shows the graph between the current
 and time
 between the time interval of 0 and 10 milliseconds as follows:
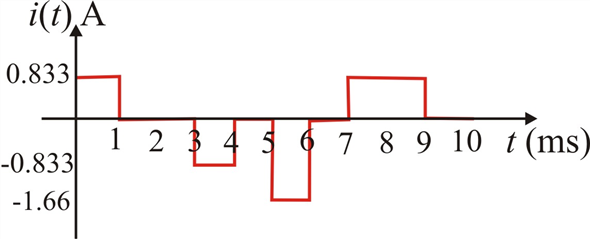 Figure 1
Therefore, the graph for the current flowing in the BOX is drawn.
For the considered graph, the slope of the curve between the energy
and time can be calculated as follows: The power absorbed can be calculate by using equation 1.3 in the text book having voltage and current as follows: …… (1)Calculate the slope of the line in between the time period of
as follows: From equation (1) the value of current is given as follows: Therefore, for time period of the current flowing into the BOX is .Calculate the slope of the line in between the time period of
as follows: From equation (1) the value of current is given as follows: Therefore, for time period of the current flowing into the BOX is .Calculate the slope of the line in between the time period of
as follows: From equation (1) the value of current is given as follows: Therefore, for time period of the current flowing into the BOX is .Calculate the slope of the line in between the time period of
as follows: From equation (1) the value of current is given as follows: Therefore, for time period of the current flowing into the BOX is .Calculate the slope of the line in between the time period of
as follows: From equation (1) the value of current is given as follows: Therefore, for time period of the current flowing into the BOX is .Calculate the slope of the line in between the time period of
as follows: From equation (1) the value of current is given as follows: Therefore, for time period of the current flowing into the BOX is .Calculate the slope of the line in between the time period of
as follows: From equation (1) the value of current is given as follows: Therefore, for time period of the current flowing into the BOX is .Calculate the slope of the line in between the time period of
as follows: From equation (1) the value of current is given as follows: Therefore, for time period of the current flowing into the BOX is .The figure 1 shows the graph between the current
and time between the time interval of 0 and 10 milliseconds as follows: Figure 1Therefore, the graph for the current flowing in the BOX is drawn.
Basic Engineering Circuit Analysis 11th Edition by David Irwin ,Robert Nelms
Why don’t you like this exercise?
Other Minimum 8 character and maximum 255 character
Character 255


