Cornerstones of Cost Management 2nd Edition by Don Hansen ,Maryanne Mowen
Edition 2ISBN: 978-1111824402Cornerstones of Cost Management 2nd Edition by Don Hansen ,Maryanne Mowen
Edition 2ISBN: 978-1111824402 Exercise 20
Quality Trend Report Objective
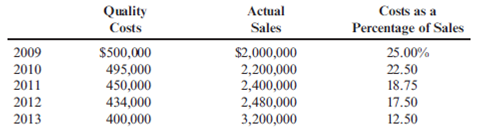
Ross Company implemented a quality improvement program and tracked the following for the five years:
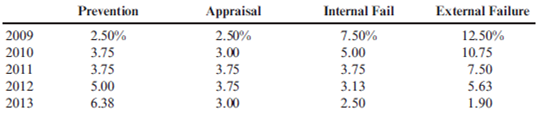
By cost category as a percentage of sales for the same period of time:
Required:
1. Prepare a bar graph that reveals the trend in quality cost as a percentage of sales (time on the horizontal axis and percentages on the vertical). Comment on the message of the graph.
2. Prepare a bar graph for each cost category as a percentage of sales. What does this graph tell you?
3. What if management would like to have the trend in relative distribution of quality costs? Express this as a bar graph and comment on its significance.
Ross Company implemented a quality improvement program and tracked the following for the five years:
By cost category as a percentage of sales for the same period of time:
Required:
1. Prepare a bar graph that reveals the trend in quality cost as a percentage of sales (time on the horizontal axis and percentages on the vertical). Comment on the message of the graph.
2. Prepare a bar graph for each cost category as a percentage of sales. What does this graph tell you?
3. What if management would like to have the trend in relative distribution of quality costs? Express this as a bar graph and comment on its significance.
Explanation Verified
(1) Prepare a bar graph:
Analysis:
• F...
Cornerstones of Cost Management 2nd Edition by Don Hansen ,Maryanne Mowen
Why don’t you like this exercise?
Other Minimum 8 character and maximum 255 character
Character 255


