Cornerstones of Cost Management 2nd Edition by Don Hansen ,Maryanne Mowen
Edition 2ISBN: 978-1111824402Cornerstones of Cost Management 2nd Edition by Don Hansen ,Maryanne Mowen
Edition 2ISBN: 978-1111824402 Exercise 49
Quality Costs: Profit Improvement and Distribution Across Categories, Gainsharing
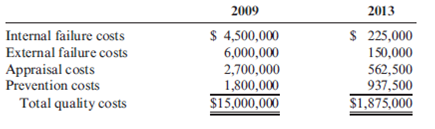
Muskogee Company had sales of $60,000,000 in 2009. In 2013, sales had increased to $75,000,000. A quality improvement program was implemented at the beginning of 2009. Overall conformance quality was targeted for improvement. The quality costs for 2009 and 2013 follow. Assume any changes in quality costs are attributable to improvements in quality.
Required:
1. Compute the quality cost-to-sales ratio for each year. Is this type of improvement possible?
2. Calculate the relative distribution of costs by category for 2009. What do you think of the way costs are distributed? (A pie chart or bar graph may be of some help.) How do you think they will be distributed as the company approaches a zero-defects state?
3. Calculate the relative distribution of costs by category for 2013. What do you think of the level and distribution of quality costs? (A pie chart or bar graph may be of some help.) Do you think further reductions are possible?
4. The quality manager for Muskogee indicated that the external failure costs reported are only the measured costs. He argued that the 2013 external costs were much higher than those reported and that additional investment ought to be made in control costs. Discuss the validity of his viewpoint.
5. Suppose that the manager of Muskogee received a bonus equal to 10 percent of the quality cost savings each year. Do you think that gainsharing is a good or a bad idea? Discuss the risks of gainsharing.
Explanation Verified
(1) Calculate the Quality costs-to-sales...
Cornerstones of Cost Management 2nd Edition by Don Hansen ,Maryanne Mowen
Why don’t you like this exercise?
Other Minimum 8 character and maximum 255 character
Character 255


