Cornerstones of Cost Management 2nd Edition by Don Hansen ,Maryanne Mowen
Edition 2ISBN: 978-1111824402Cornerstones of Cost Management 2nd Edition by Don Hansen ,Maryanne Mowen
Edition 2ISBN: 978-1111824402 Exercise 65
Trend, Long-Range Performance Report
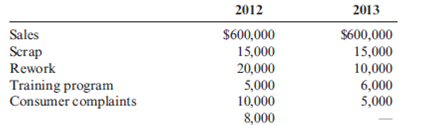
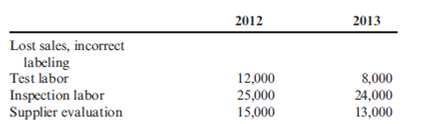
In 2012, Tru-Delite Frozen Desserts, Inc., instituted a quality improvement program. At the end of 2013, the management of the corporation requested a report to show the amount saved by the measures taken during the year. The actual sales and quality costs for 2012 and 2013 are as follows:
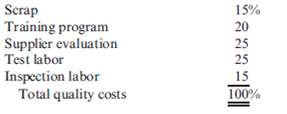
Tru-Delite's management believes that quality costs can be reduced to 2.5 percent of sales within the next five years. At the end of 2017, Tru-Delite's sales are projected to grow to $750,000. The projected relative distribution of quality costs at the end of 2017 is as follows:
Required:
1. Profits increased by what amount due to quality improvements made in 2013?
2. Prepare a long-range performance report that compares the quality costs incurred at the end of 2013 with the quality cost structure expected at the end of 2017.
3. Are the targeted costs in the year 2017 all value-added costs? How would you interpret the variances if the targeted costs are value-added costs?
4. What would be the profit increase in 2017 if the 2.5 percent performance standard is met in that year?
In 2012, Tru-Delite Frozen Desserts, Inc., instituted a quality improvement program. At the end of 2013, the management of the corporation requested a report to show the amount saved by the measures taken during the year. The actual sales and quality costs for 2012 and 2013 are as follows:
Tru-Delite's management believes that quality costs can be reduced to 2.5 percent of sales within the next five years. At the end of 2017, Tru-Delite's sales are projected to grow to $750,000. The projected relative distribution of quality costs at the end of 2017 is as follows:
Required:
1. Profits increased by what amount due to quality improvements made in 2013?
2. Prepare a long-range performance report that compares the quality costs incurred at the end of 2013 with the quality cost structure expected at the end of 2017.
3. Are the targeted costs in the year 2017 all value-added costs? How would you interpret the variances if the targeted costs are value-added costs?
4. What would be the profit increase in 2017 if the 2.5 percent performance standard is met in that year?
Explanation Verified
(1) Calculate the due amount to quality ...
Cornerstones of Cost Management 2nd Edition by Don Hansen ,Maryanne Mowen
Why don’t you like this exercise?
Other Minimum 8 character and maximum 255 character
Character 255


